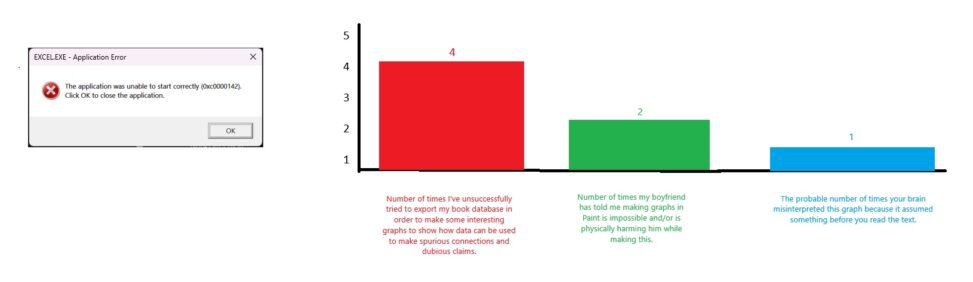
You can visualize anything in a graph, and that’s why you should always be critical to its content and what it’s actually showing.

A SPLOT on the Web: DALI worlds.
Blame @cogdog for the TRU Collector Theme, based on Fukasawa by Anders Norén.
You can visualize anything in a graph, and that’s why you should always be critical to its content and what it’s actually showing.