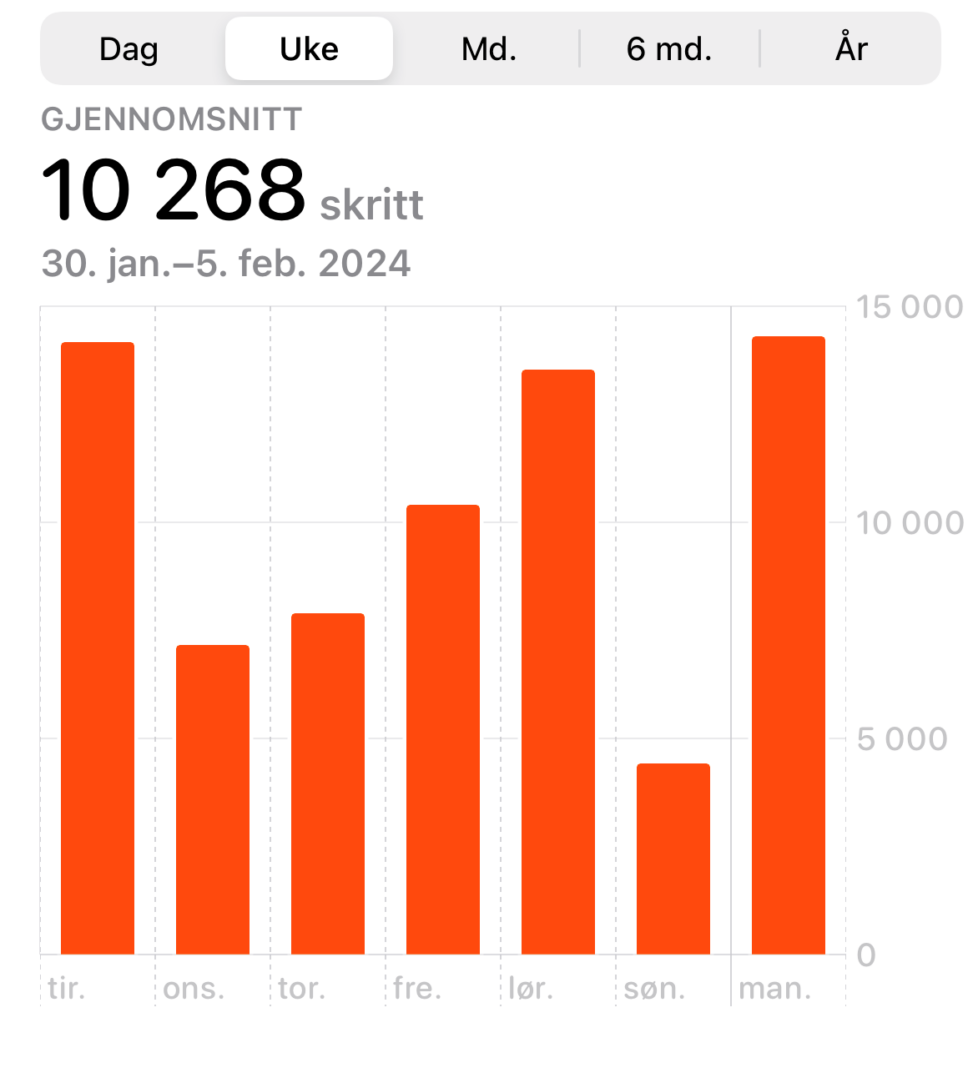
The data shows the average steps taken troughout a week. Each day is represented by a pole, with the days on the x-axis (Tirsday to Monday) and the total steps on the y-aksis. The time periode for this data is from Jannuary 30th – February 5th 2024.

A SPLOT on the Web: DALI worlds.
Blame @cogdog for the TRU Collector Theme, based on Fukasawa by Anders Norén.
The data shows the average steps taken troughout a week. Each day is represented by a pole, with the days on the x-axis (Tirsday to Monday) and the total steps on the y-aksis. The time periode for this data is from Jannuary 30th – February 5th 2024.