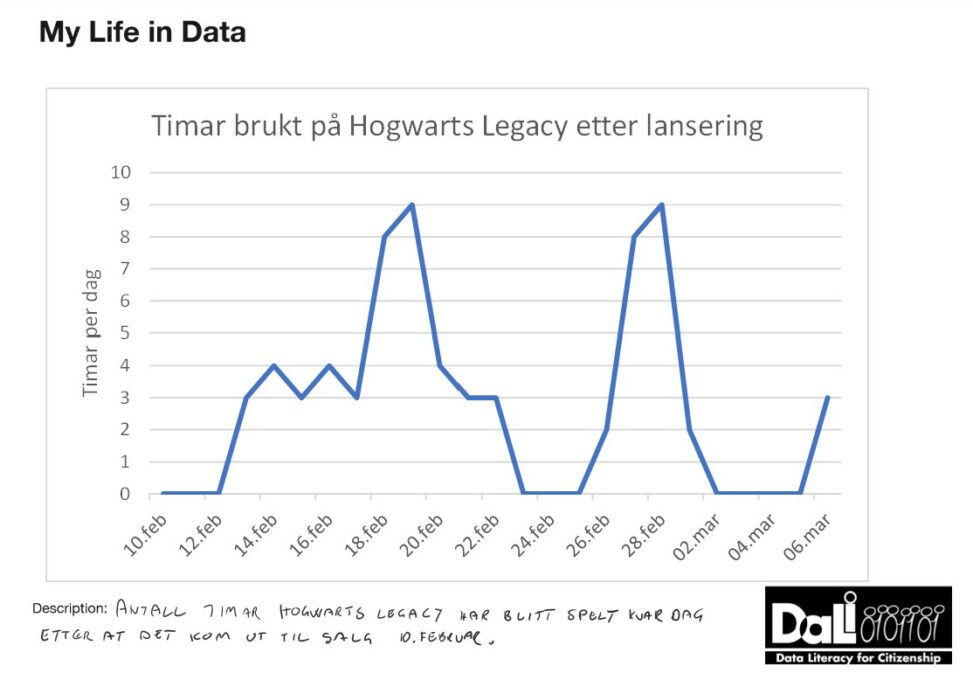
The line represents how many hours I have spent every day from the 10th of February until the 6th of March playing the video game Hogwarts Legacy. The data is represented by a graph that I made in Microsoft Excel.

A SPLOT on the Web: DALI worlds.
Blame @cogdog for the TRU Collector Theme, based on Fukasawa by Anders Norén.
The line represents how many hours I have spent every day from the 10th of February until the 6th of March playing the video game Hogwarts Legacy. The data is represented by a graph that I made in Microsoft Excel.