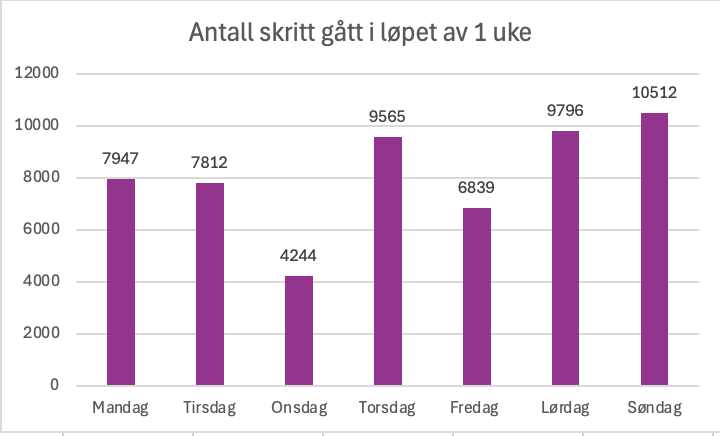
Datavisualiseringen viser hvor mange skritt jeg gikk i løpet av en uke, målt i antall skritt per dag. Dataene er målt med apple Watch.

A SPLOT on the Web: DALI worlds.
Blame @cogdog for the TRU Collector Theme, based on Fukasawa by Anders Norén.
Datavisualiseringen viser hvor mange skritt jeg gikk i løpet av en uke, målt i antall skritt per dag. Dataene er målt med apple Watch.