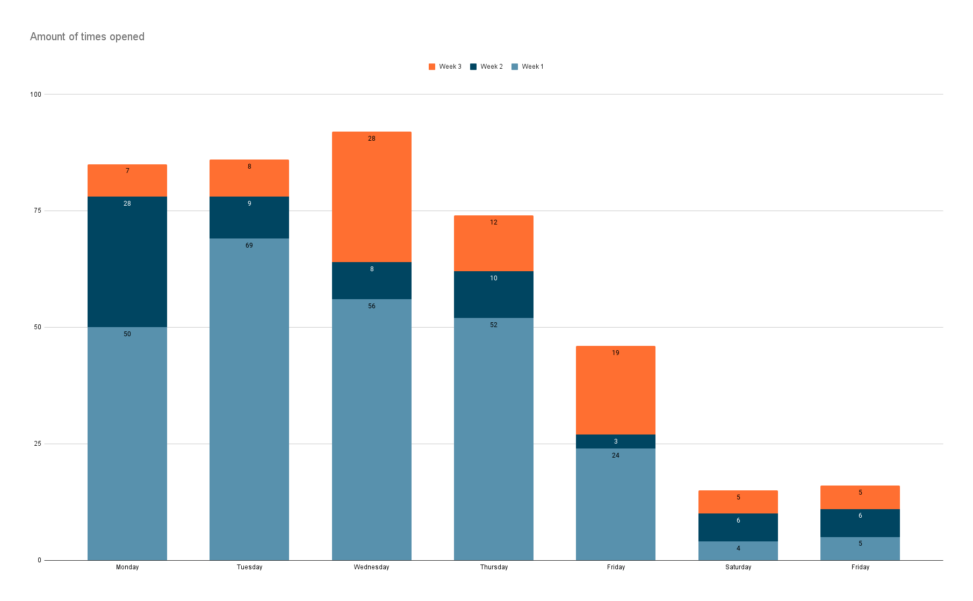
A chart showcasing the amount of times the submitters phone has been opened in the span of 3 weeks.
The chart ranges from Monday to Sunday.
Week 1: 50,69,56,52,24,4,5.
Week 2: 28,9,8,10,3,6,6.
Week 3: 7,8,28,12,19,5,5.


A chart showcasing the amount of times the submitters phone has been opened in the span of 3 weeks.
The chart ranges from Monday to Sunday.
Week 1: 50,69,56,52,24,4,5.
Week 2: 28,9,8,10,3,6,6.
Week 3: 7,8,28,12,19,5,5.