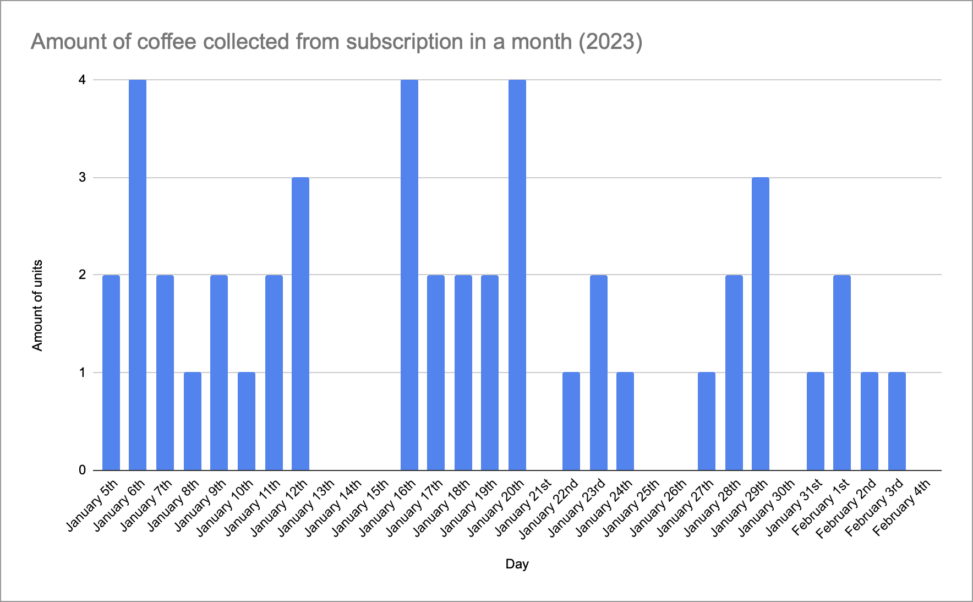
This graph shows the amount of coffee units collected by me during a month (January 5th to February 4th). I had a coffee subscription at the time and decided to log my behavior.
I own the data and make it open for any use.

This graph shows the amount of coffee units collected by me during a month (January 5th to February 4th). I had a coffee subscription at the time and decided to log my behavior.
I own the data and make it open for any use.