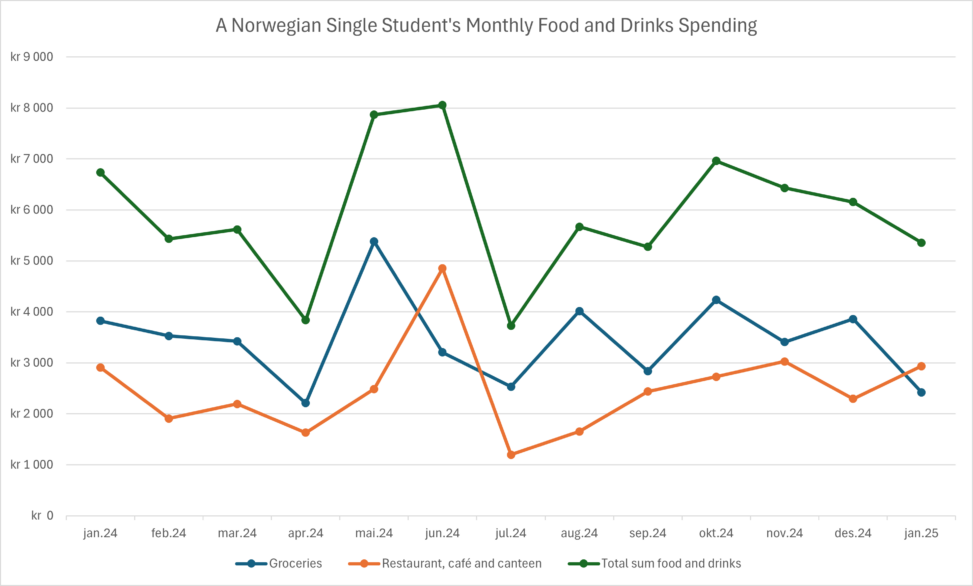
The visualisation is showing the monthly food and drinks spending from January 2024 to January 2025 in Norwegian kroner. Food and drinks are split into two categories: groceries and restaurant, café and canteen. Additionally, the visualisation includes a total sum line representing the monthly total sum spent on food and drinks. I have used Microsoft Excel to create it.