
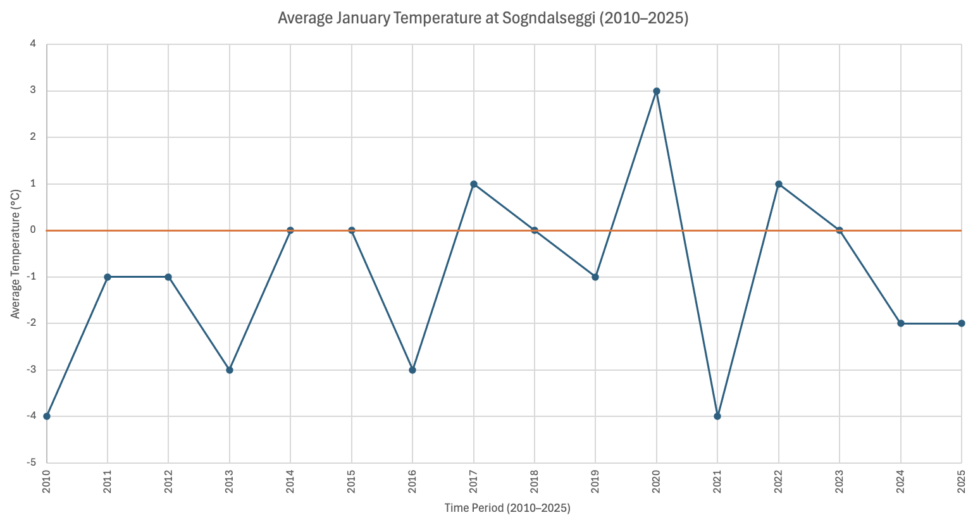
This chart shows the average January temperature at Sogndalseggi from 2010 to 2025, based on data from timeanddate.com. The x-axis represents years (2010–2025), and the y-axis shows temperature in degrees Celsius (°C), ranging from -5°C to 4°C. The orange horizontal line marks the freezing point (0°C).
The data highlights year-to-year temperature variability, with notable spikes and dips, reflecting local climate trends.