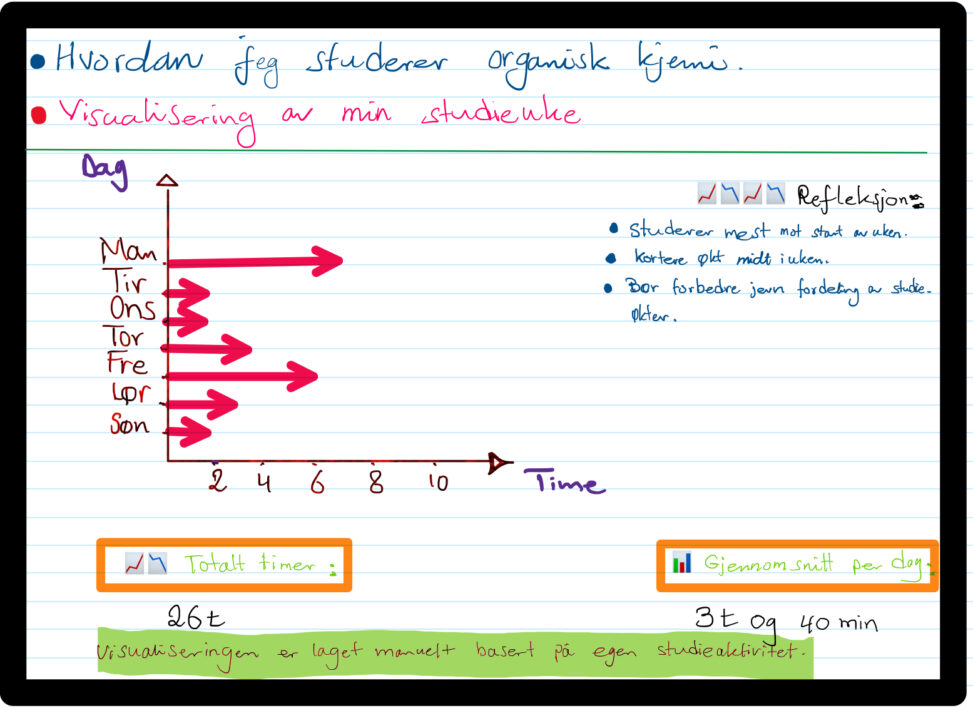
This data visualization shows how many hours I studied organic chemistry during one week. The data represents my personal study activity measured in hours per day from Monday to Sunday. The purpose of the visualization is to show how everyday activities can be transformed into data and analysed to understand study patterns and productivity. The data is self collected and created by me, and the visualization is manually produced.