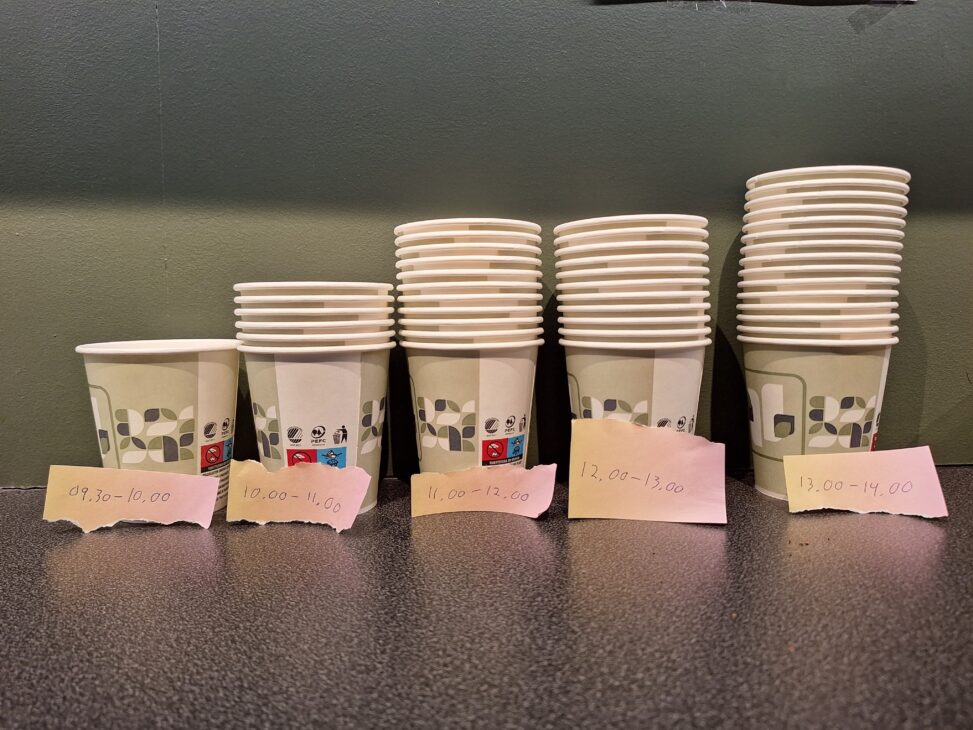
The data is represented through paper cups stacked on top of one another. It visually shows how many paper cups are being used during only one shift at the student bar. The data was collected by me physically during my own morning shift at the student bar.

Shared By: Anonymous
Source: Morning shift at Ad Fontes
Image Alt Text: This is a visual representation of the amount of one-time-use cups given out at the studentbar Ad Fontes. It shows how many one-time-use cups that are being used and thrown away during one morning shift.