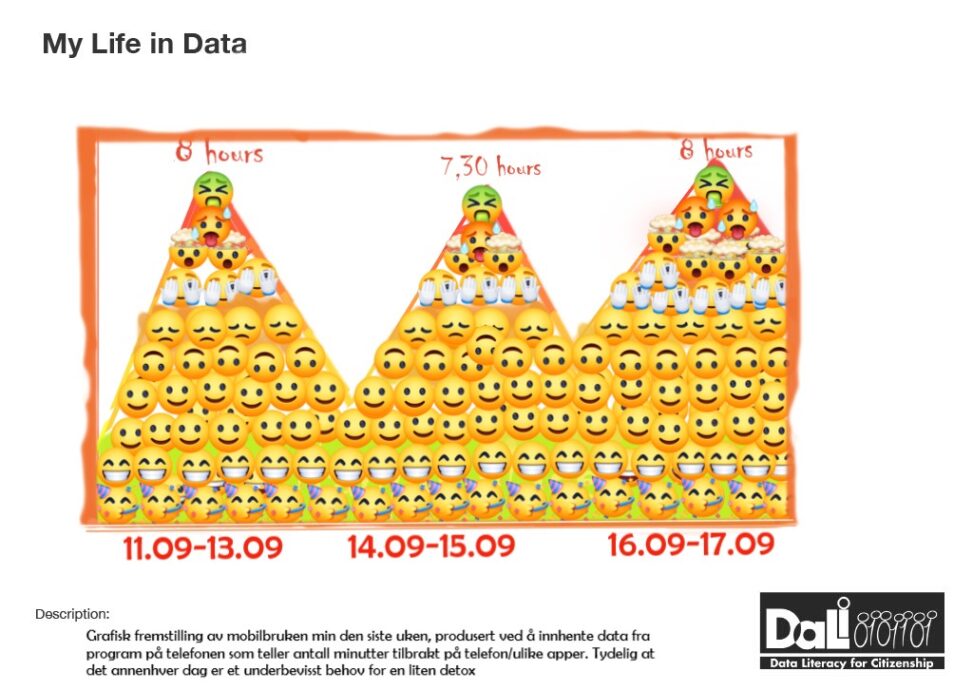
Graph showing the amount of time spent on my phone over a week periode from 11.09-17.09. Data collected from my phone’s (Huawei) system that collect data about my app-use. Illustrated with the emojis that indicate how my mood was over the same period of time from self-reported data collected in a handwritten short journal.