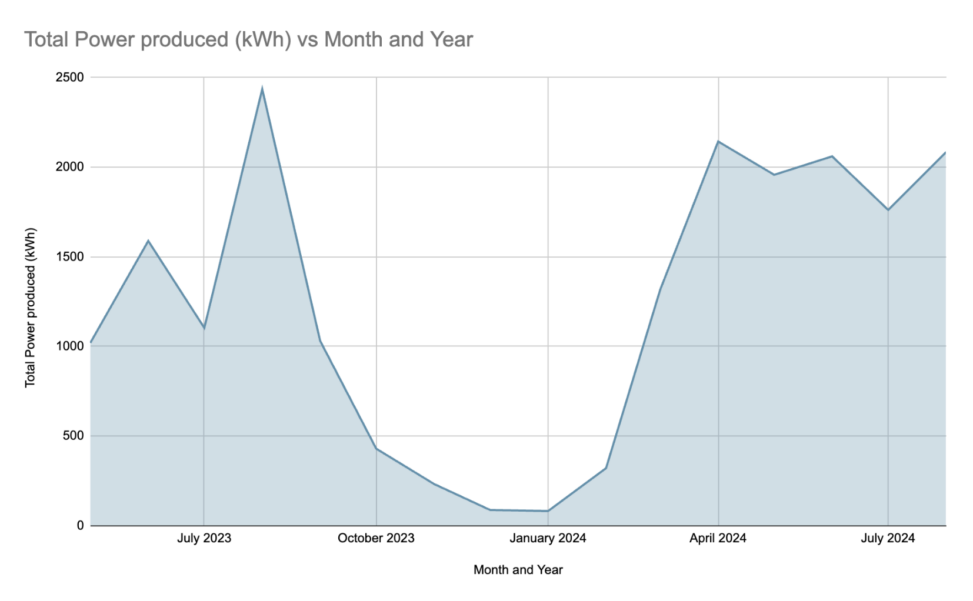
This is a graph of the solar power produced from the solar panels on my house. The graph starts in may 2023 and ends in August 2024. The power is measured in kilowatt hours (kWh).


This is a graph of the solar power produced from the solar panels on my house. The graph starts in may 2023 and ends in August 2024. The power is measured in kilowatt hours (kWh).