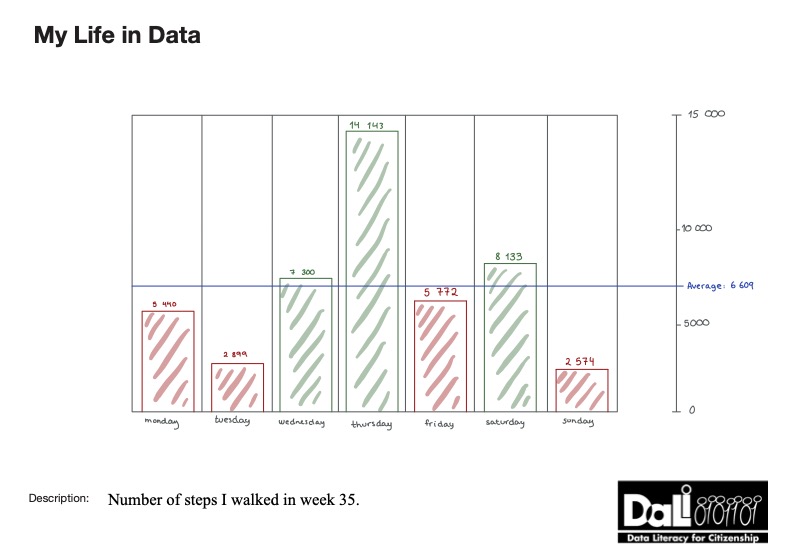
This shows how many steps I walked each day in week 35, where the red poles represent the days that were bellow average, and the green poles represent the days that were above average.

A SPLOT on the Web: DALI worlds.
Blame @cogdog for the TRU Collector Theme, based on Fukasawa by Anders Norén.
This shows how many steps I walked each day in week 35, where the red poles represent the days that were bellow average, and the green poles represent the days that were above average.