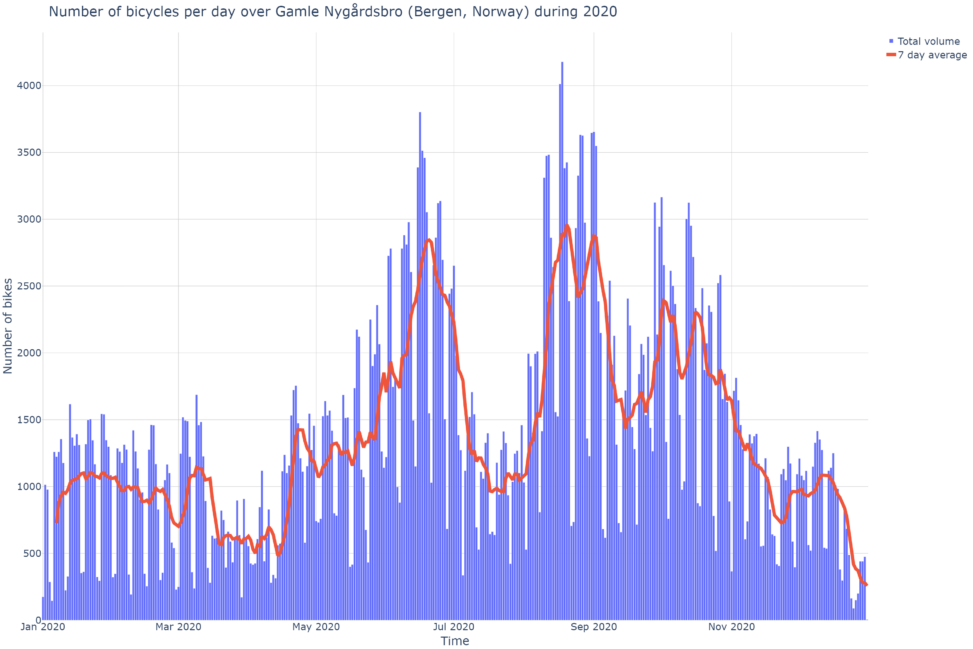
The visualisation is a graph showing the daily number of bicycle crossings in 2020 (early Covid-19) over a measuring point set up by The Norwegian Public Roads Administration at Gamle Nygårdsbro, Bergen, Norway. The graph also shows the 7 day rolling average for each day. CC BY-NC-ND