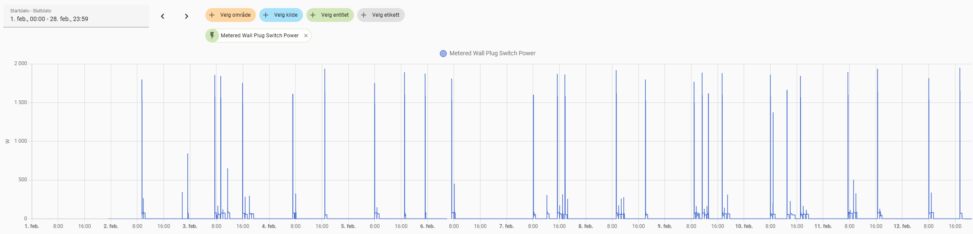
The graph shows the power consumption in watts on the vertical axis, and time on the horizontal axis. Seen together they represent the total power consumption in watt hours. The graph also shows when I drink coffee

A SPLOT on the Web: DALI worlds.
Blame @cogdog for the TRU Collector Theme, based on Fukasawa by Anders Norén.
The graph shows the power consumption in watts on the vertical axis, and time on the horizontal axis. Seen together they represent the total power consumption in watt hours. The graph also shows when I drink coffee