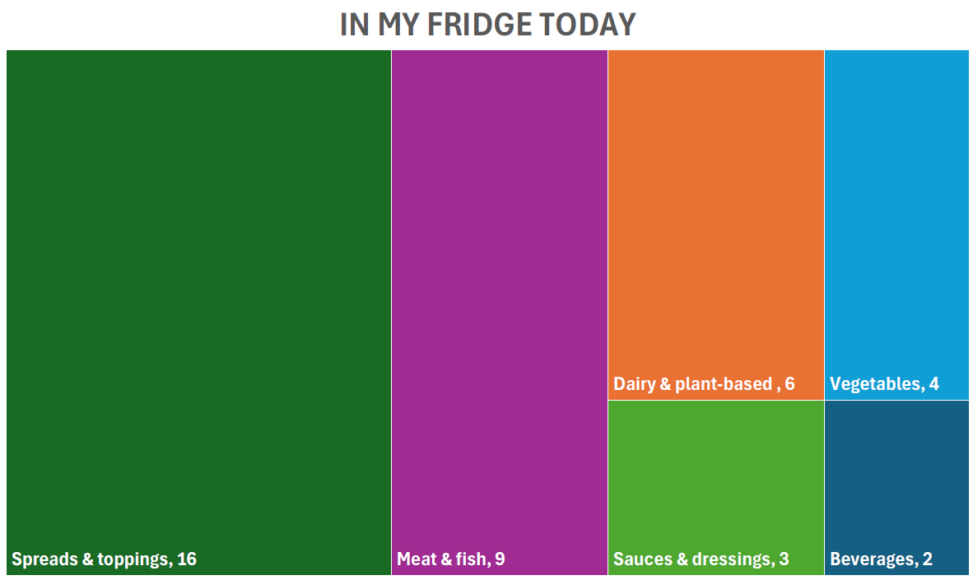
This treemap visualization represents the number of food items in my refrigerator, categorized into beverages, dairy and plant-based products, spreads and toppings, vegetables, meat and fish and sauces and dressings. The data was collected on 16.02.2025 in a typical townhouse housing a family of four in Bergen, Norway. The size of each section reflects the number of items in that category. The units are the number of individual food items per category. The visualization was created using Microsoft Excel. The data is personally collected and not subject to copyright restrictions. The visualization is my own creation.


