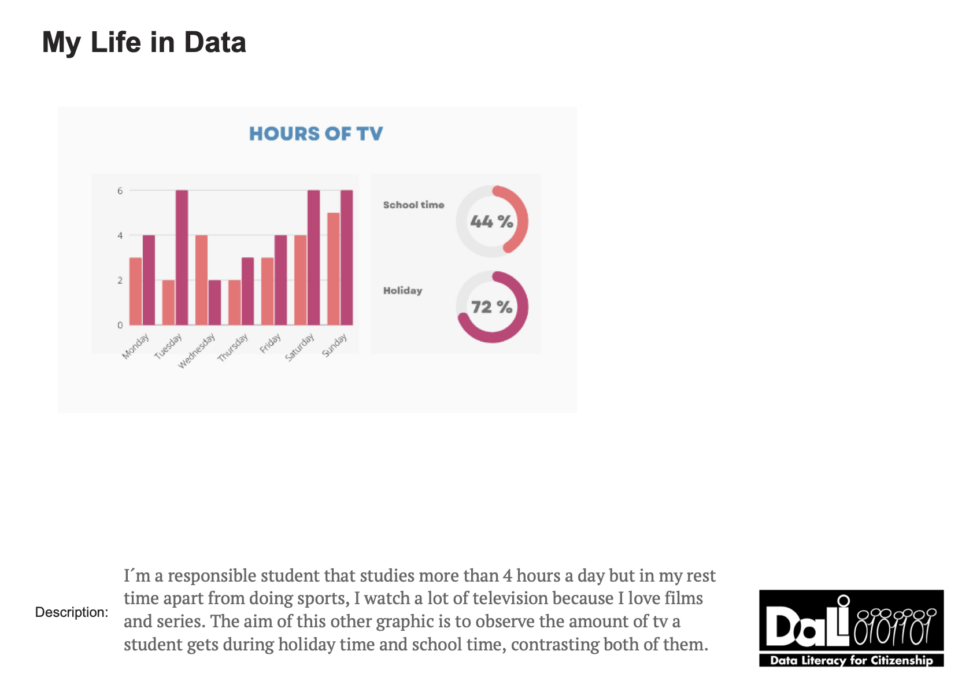
In this post we can she the hours of tv i watched in my daily life. Contratsing the time of tv watched in holidays and the time of tv watched at the rest of the school time.

A SPLOT on the Web: DALI worlds.
Blame @cogdog for the TRU Collector Theme, based on Fukasawa by Anders Norén.
In this post we can she the hours of tv i watched in my daily life. Contratsing the time of tv watched in holidays and the time of tv watched at the rest of the school time.