
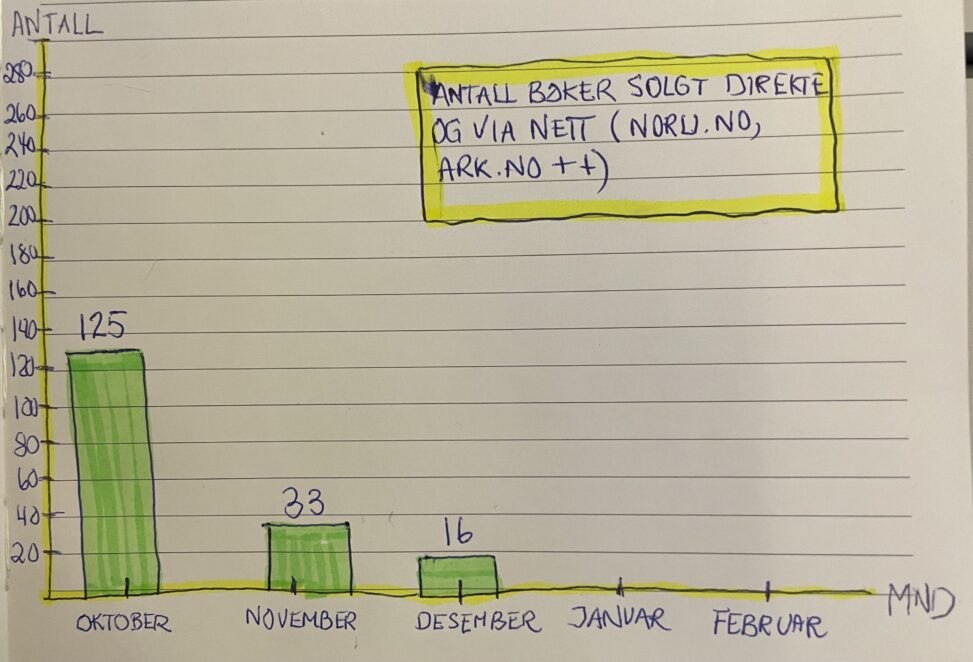
This visualization shows the number of copies of the poetry collection sold per month in Q4 2025. The data represents total units sold (number of books) through direct sales and online retailers (such as Norli.no, Ark.no and other online platforms).
The months included are October, November and December 2025. The vertical axis represents number of books sold (units), and the horizontal axis represents months.
Data source: Sales data from the author’s own records, including direct sales and sales reports from online retailers.
Copyright status: The data is privately owned by the author (Camilla Flesland) and is not publicly available. The visualization is based on original, self-collected data.