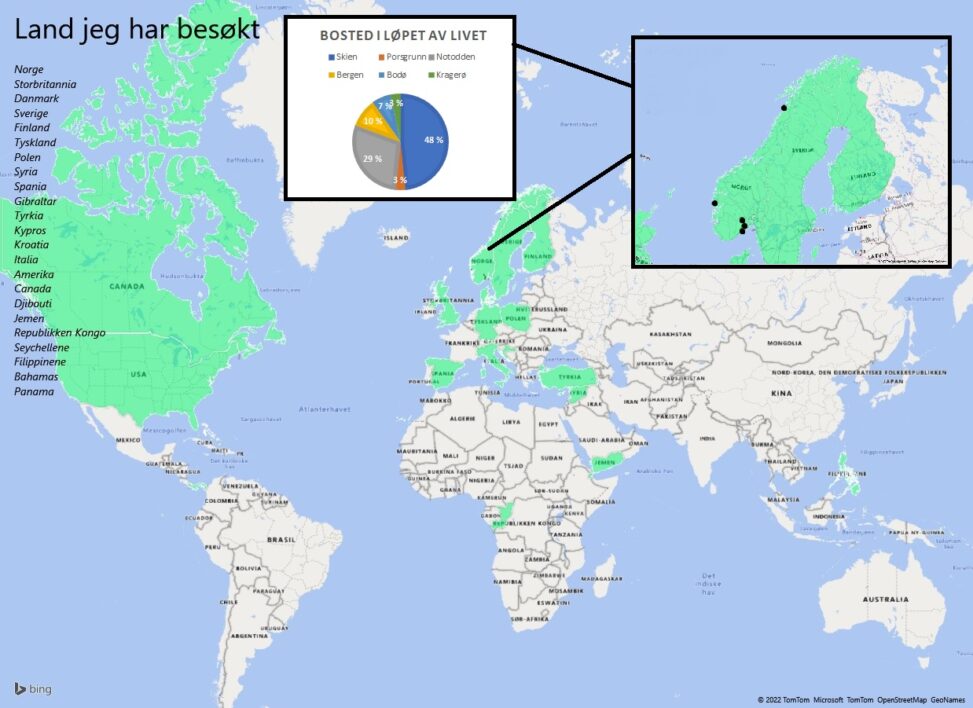
The data have been plotted into “Microsoft Excel”, and converted over to “Excel 3D map”. Tha data contains the countries I’ve visited, and places I’ve lived. I then screenshoted the two layers and copied it in to paint to put it all together. The last part i copied from “Microsoft Excel”. That contains the number of years I’ve lived in each city during my life and converted into a sector diagram to get the percentage of my life I’ve lived each place