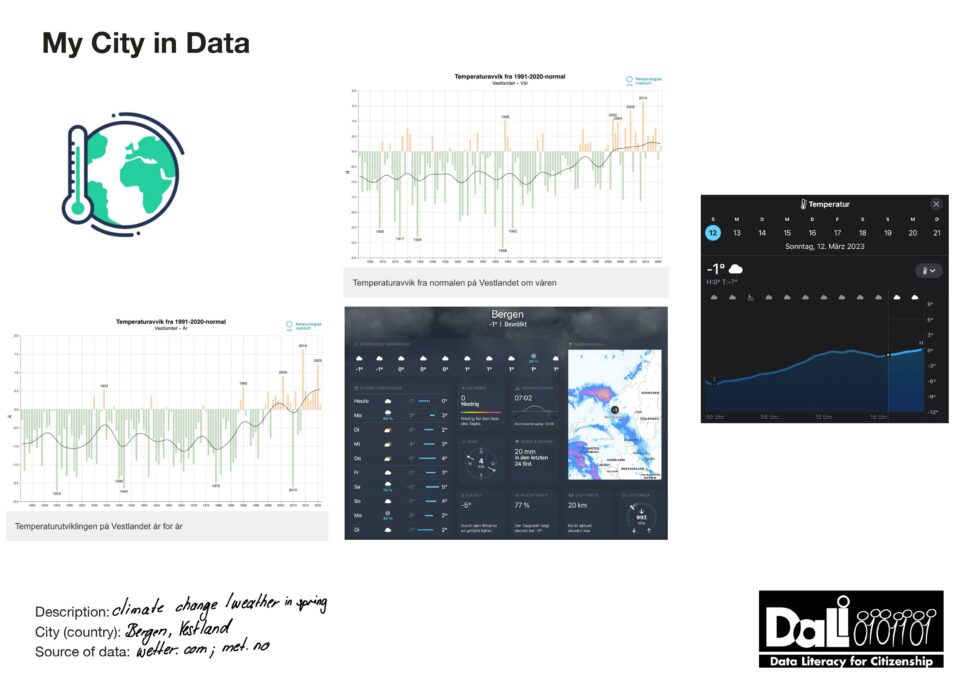
The Graphics show the climate change in Norway from 1900 – today for the whole year and also one in spring. As a contrast I added the graphics from the weather today and the coming week, to distinguish the differences.
source graphics

A SPLOT on the Web: DALI worlds.
Blame @cogdog for the TRU Collector Theme, based on Fukasawa by Anders Norén.
The Graphics show the climate change in Norway from 1900 – today for the whole year and also one in spring. As a contrast I added the graphics from the weather today and the coming week, to distinguish the differences.
source graphics