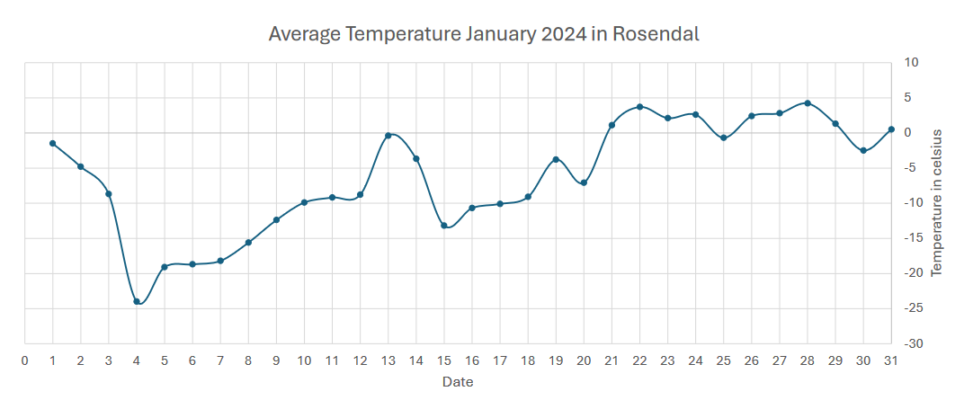
The average temperature in my hometown of Rosendal in January 2024. The data was from the norwegian weather service yr.no , and visualized in a graph using power point.
The x-axis represents the date, and the y-axsis represents the average temperature that day.