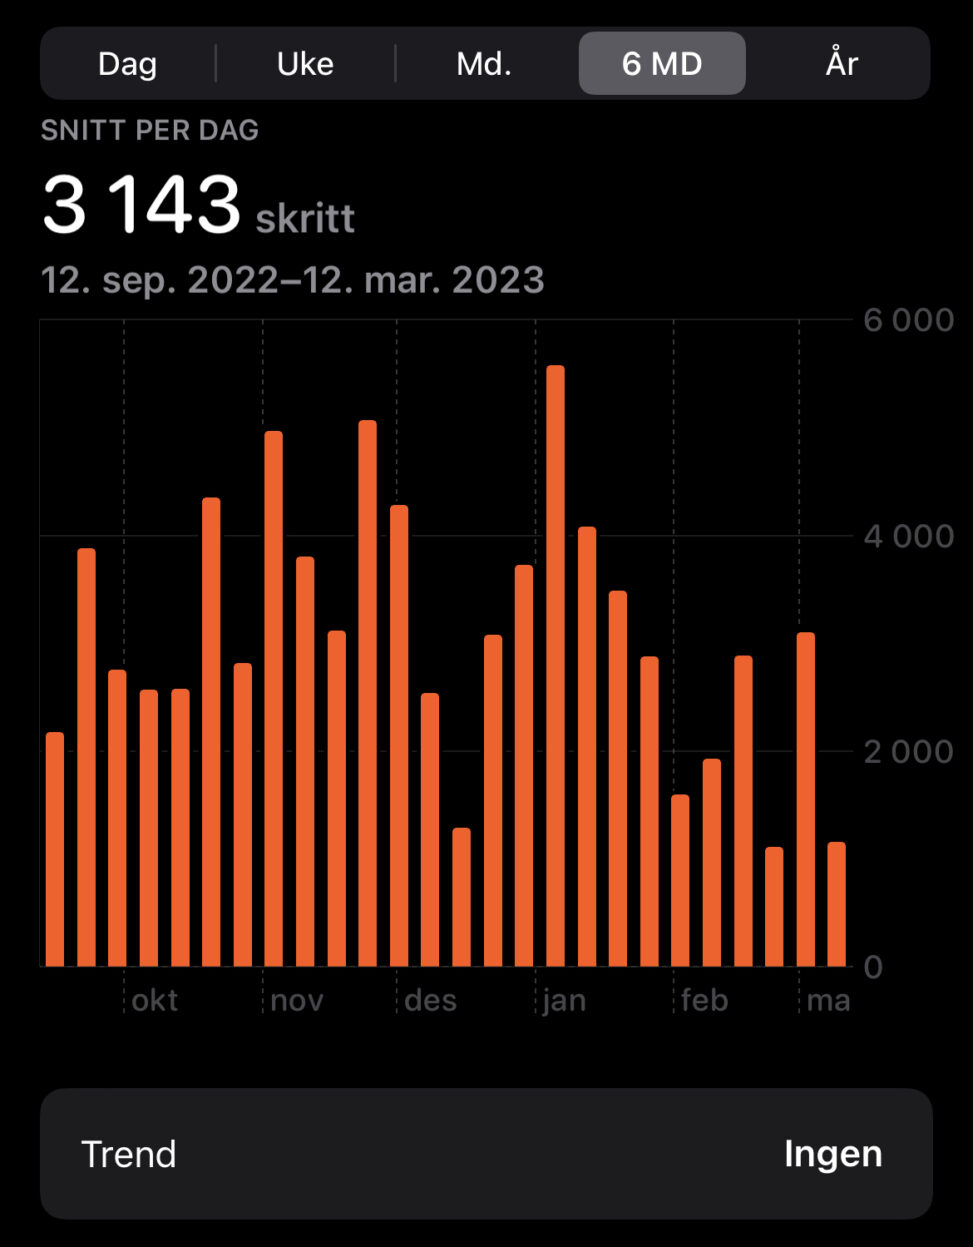
The diagram shows the average number of steps I have taken over the past 6 months. We see in January that more steps were taken than usual. It’s because I was on a trip and usually more steps are taken on trips than in everyday life.

A SPLOT on the Web: DALI worlds.
Blame @cogdog for the TRU Collector Theme, based on Fukasawa by Anders Norén.
The diagram shows the average number of steps I have taken over the past 6 months. We see in January that more steps were taken than usual. It’s because I was on a trip and usually more steps are taken on trips than in everyday life.