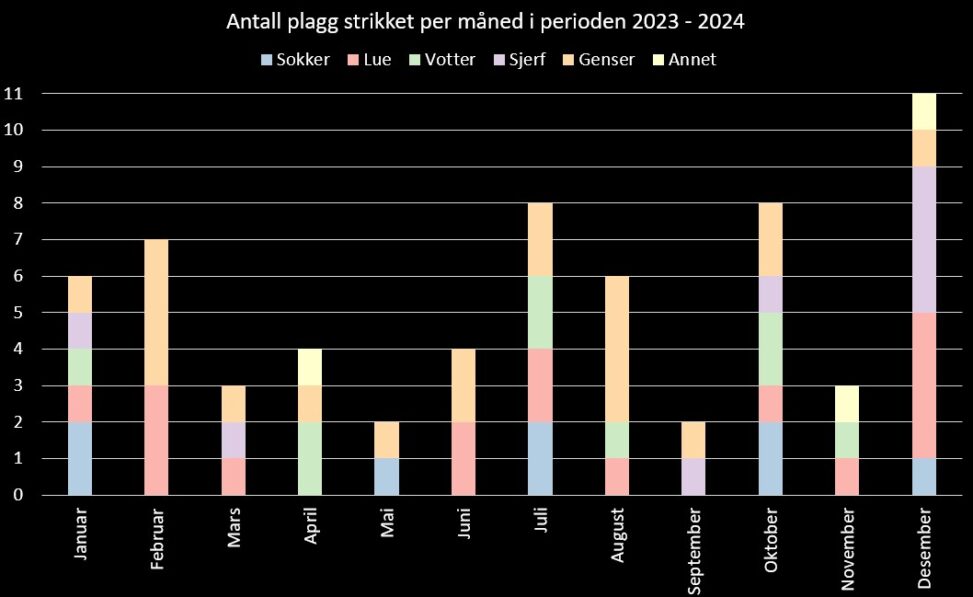
A stacked column graph that shows the amount of garments I have knit per month in the period 2023 – 2024. The values in the graph column are categorized by garment type. I am the owner of this data.

A SPLOT on the Web: DALI worlds.
Blame @cogdog for the TRU Collector Theme, based on Fukasawa by Anders Norén.
A stacked column graph that shows the amount of garments I have knit per month in the period 2023 – 2024. The values in the graph column are categorized by garment type. I am the owner of this data.