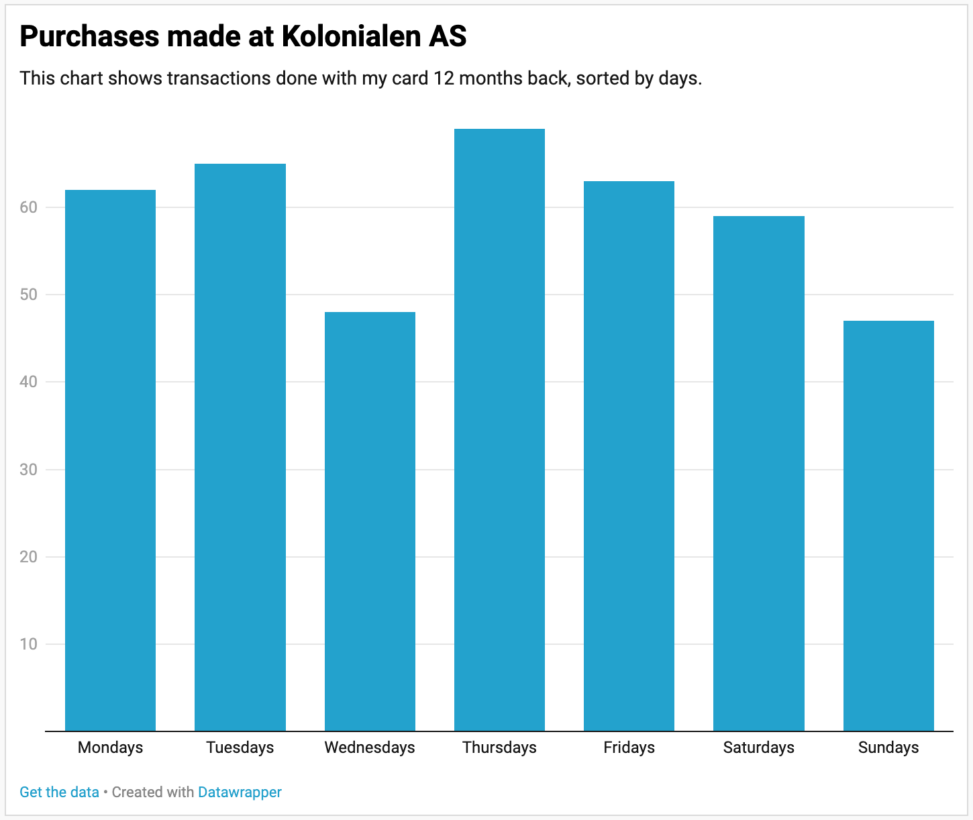
This chart shows transactions done with my card in a local corner shop called Kolonialen. Source of data is my account statement, and I made a little program in Python to filter the data, and sort them by weekday.

A SPLOT on the Web: DALI worlds.
Blame @cogdog for the TRU Collector Theme, based on Fukasawa by Anders Norén.
This chart shows transactions done with my card in a local corner shop called Kolonialen. Source of data is my account statement, and I made a little program in Python to filter the data, and sort them by weekday.