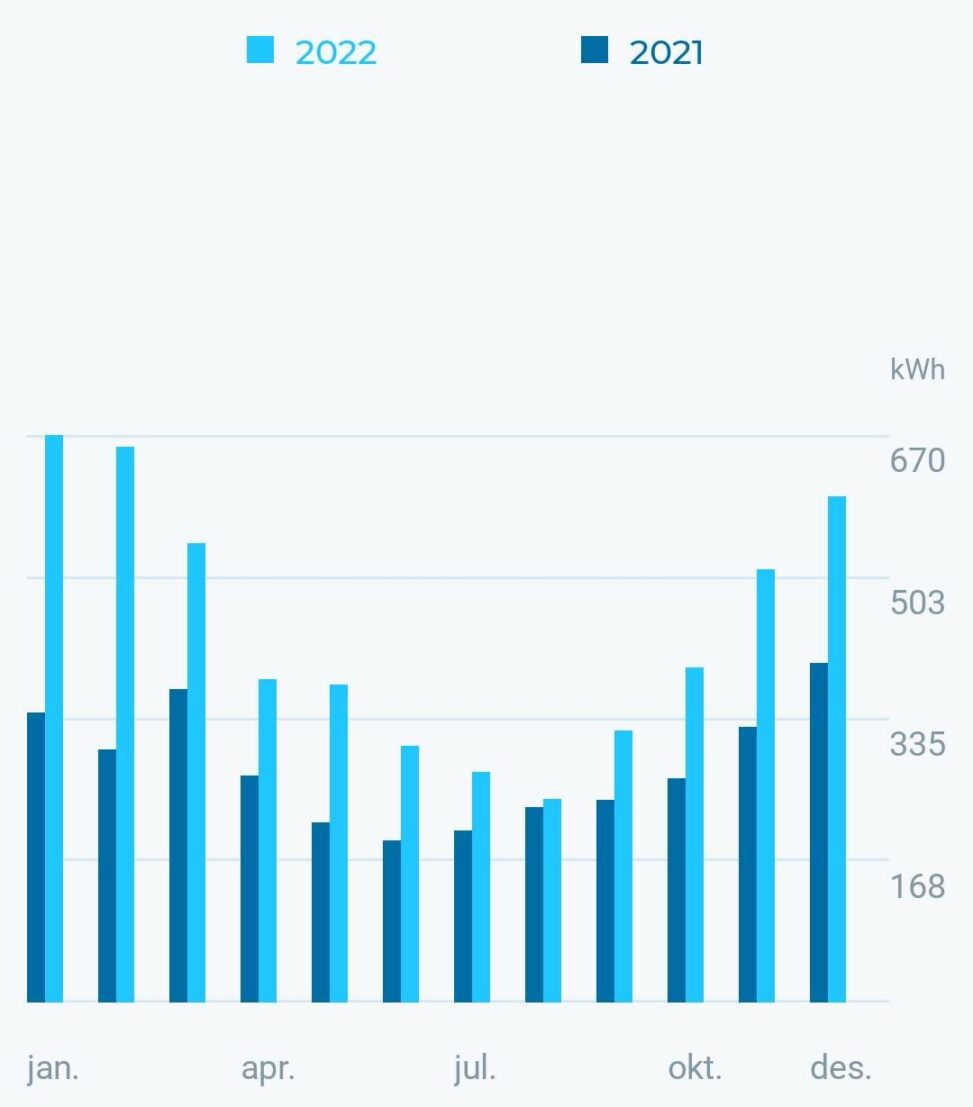
The bar chart shows my energy consumption, comparing 2022 to 2021. Along the x-axis are the months and the y-axis shows the amount of kWh used (1kWh = running a 1000W device for an hour). The energy useage follows a stable, cyclic, pattern where naturally, during summer, the use is lower as the summer-temperature is usually higher, even in Bergen, and less energy is used for heating.