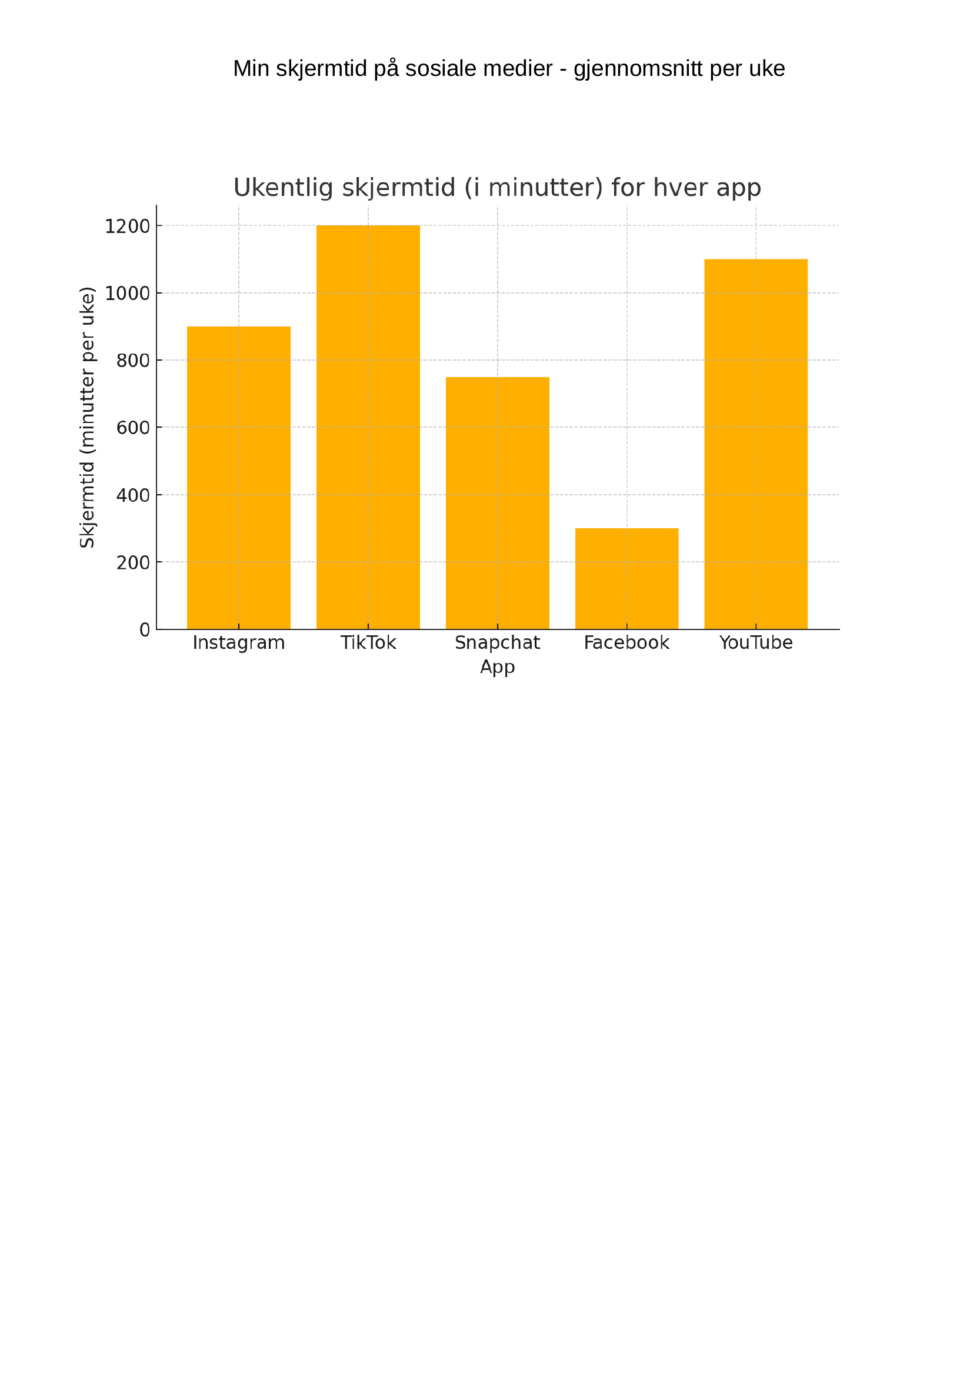
This data visualization is a bar chart representing the average weekly screen time (measured in minutes) spent on various social media platforms. The platforms included in this visualization are Instagram, TikTok, Snapchat, Facebook, and YouTube. Each bar represents the total time spent on a platform per week. The data is hypothetical but adjusted to reflect a realistic usage pattern. The chart is created for an educational purpose as part of the DIGI110 course, and the data is self-reported. This visualization is shared under a Creative Commons license.