
2107 Data visualizations Categorized "my life in data" (page 9 of 106)
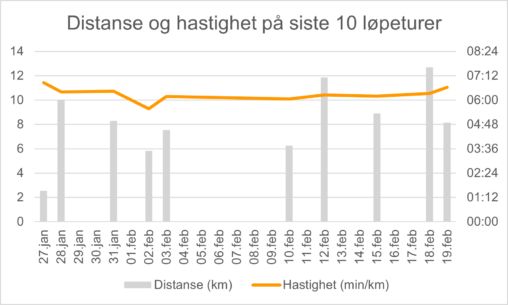
Hastighet og distanse for de siste 10 løpeturene mine. Viser vel at jeg putrer av gårde i samme tempo nesten uansett…
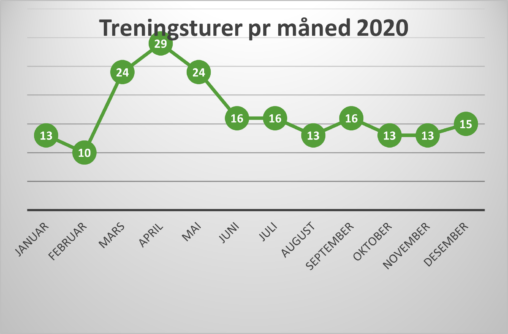
Months and number of work out hours. I am the owner of the data I have visualized.
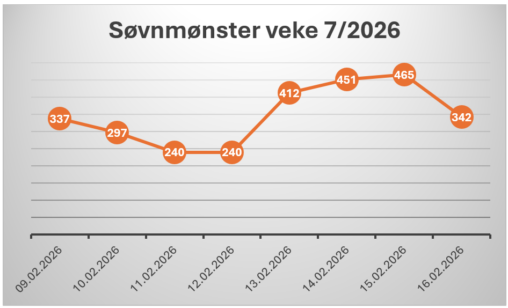
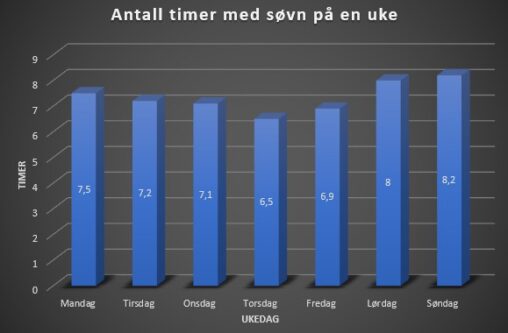
Diagrammet representerer mitt søvnmønster i veke 7-8 2026. I denne perioden var eg sjuk nokre dagar, og lengda og kvaliteten på søvnen varierte ein del.
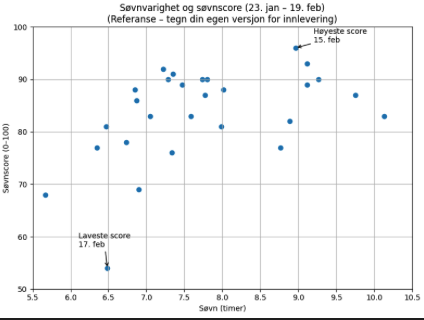
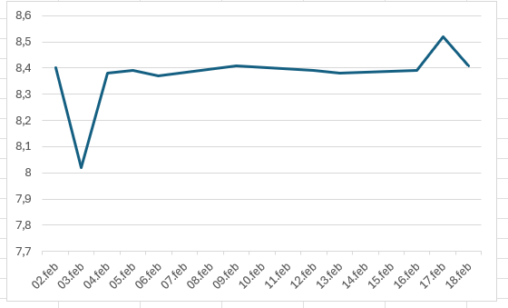
Visualiseringen viser min registrerte søvn i perioden 23. januar–19. februar. Hvert datapunkt representerer én natt og viser forholdet mellom søvnvarighet (timer og minutter omregnet til timer på x-aksen)…
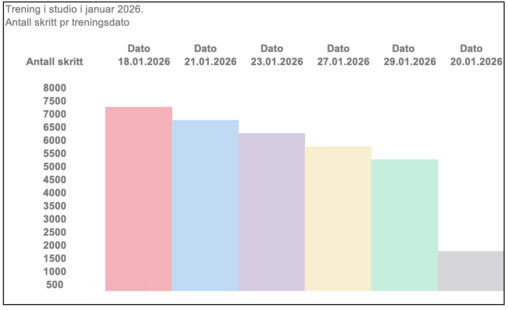
SPENST PROVIDED DATA ON dates I attended the studio. My Oura Ring 4 provided steps per work out session in January
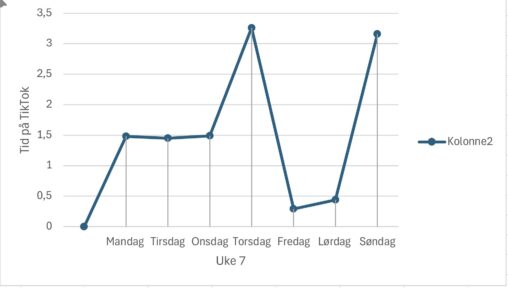
Dette er en observasjon på hvor mye skjermtid, jeg som 19 år gammel jente bruker på TikTok. Har gjort dette gjennom en uke, ved å bruke skjermtid appen.
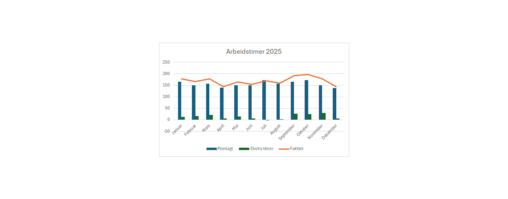
Arbeidet i løpet av året organiseres og rapporteres i 3 tertialer. Visualiseringen viser en korrelasjon mellom antall timer arbeidet utover ordinær arbeidstid og forberedelse til og avslutning av…
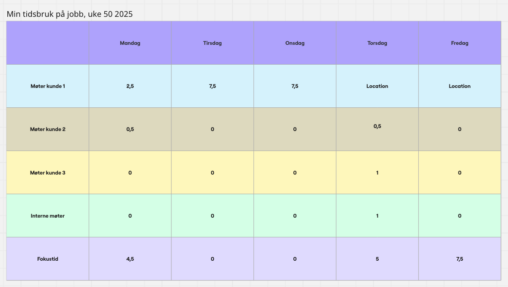
The table shows data from a work week of mine, telling hours spent in meetings with different clients and my focus time.
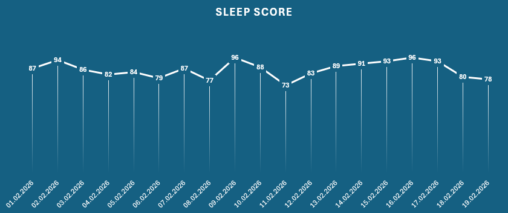
This chart visualizes daily sleep scores for the month of February 2026, recorded by an Oura Ring device. Each point on the line graph represents the sleep score…
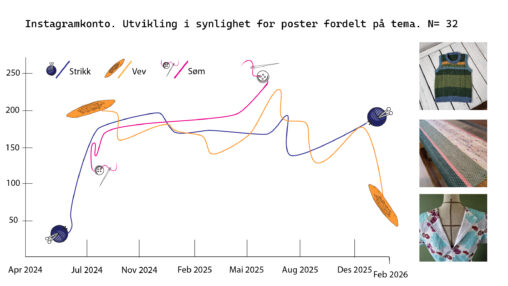
The image shows the development of reach for the Instagram account Trsemakesstuff between June 2024 and February 2026. The account shows images of three different activities: knitting, weaving…
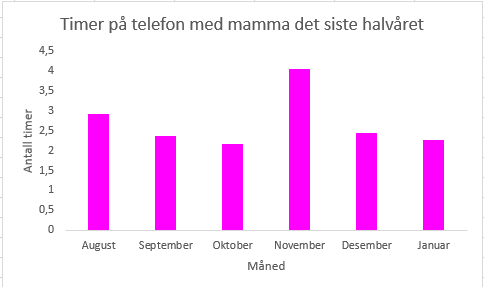
Bildet visualierer hvor mange timer jeg har brukt på telefonen med min mamma det siste halve året, fra august 2025 frem til og med januar 2026.Basert på data…
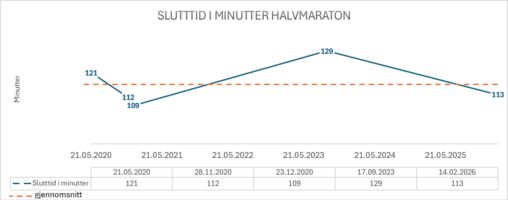
Grafen viser sluttid i minutter for gjennomførte halvmaraton de siste årene, inkludert gjennomsnittlig sluttid
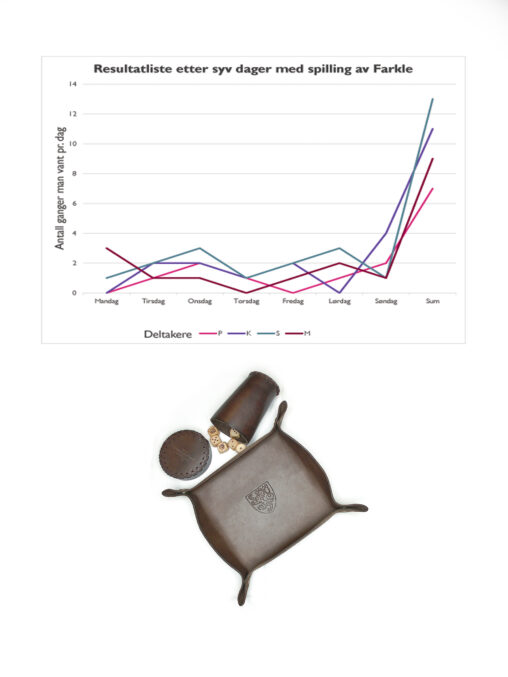
Vi har spilt Farkle, den fysiske varianten, i syv dager. Det var fire deltakere. Visualiseringen viser hvem som har vunnet hver dag. Til slutt er resultatene summert og…

Visualiseringen viser syv dagers spilling med den fysiske varianten av terningspillet Farkle. Vi var fire deltakere. Det er kun registrert hvem som har vunnet hver dag. Antall ganger…
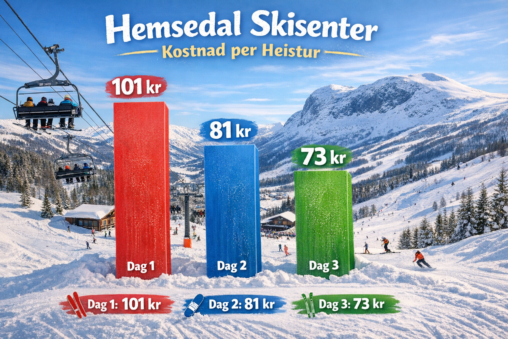
Kostnad per heistur i Hemsedal skisenter for mine tre dager der i vinterferien. Bildet er laget ved hjelp av Copilot
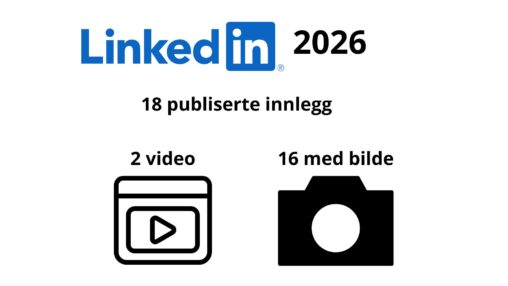
Dette er en visualisering av antall innlegg Eline har publisert på LinkedIn i 2026 og hvordan de er fordelt mellom video og bilde innlegg
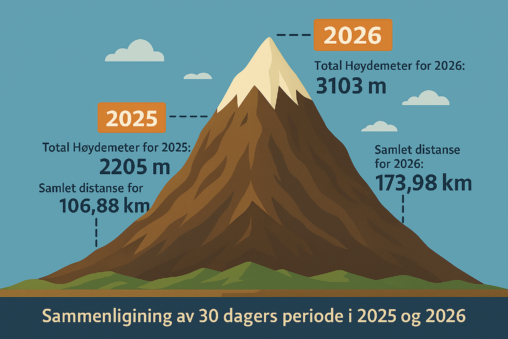
Jeg ba Copilot lage illustrasjon av et fjell hvor det vises tydelig forholdet mellom 2025 og 2026 når tallene er: Total Høydemeter for 2025: 2205 m Samlet distanse…
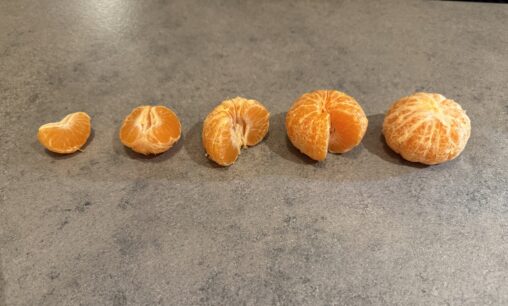
Dette bildet representerer data over hvor mange klementinbåter familiehunden får fra hvert familiemedlem når de spiser klementiner. Hunden vår elsker klementiner, det er det beste han vet, dermed,…