
2077 Data visualizations Categorized "my life in data" (page 75 of 104)


Personlig løpsresultat oppgitt i tid (minutter) etter deltagelse i Stoltzekleiven opp i Bergen i årene 2007, 2008, 2009, 2010, 2011, 2015, 2016 og 2017.

A visualisation of my personal time spent playing games on my steam account from 6. Feb 2024 – 20 Feb 2024. Data is given in hours spent playing….
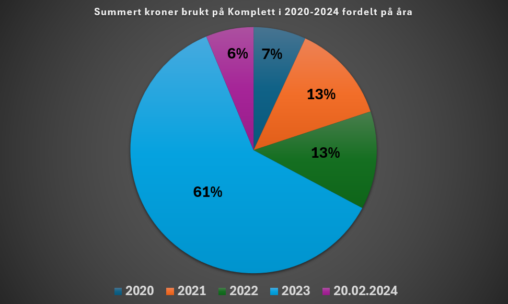
Graph shows what the percentage of summed money, from 01.01.2020 to 20.02.2024, is spent across those same years.
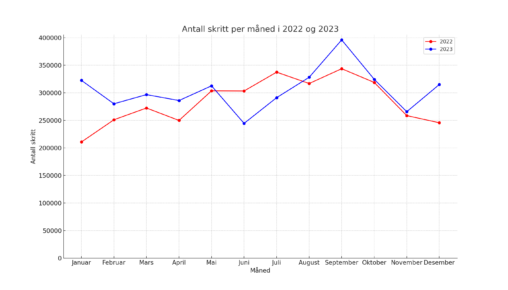
Antall skritt gått måned for måned for årene 2022 og 2023.
file:///C:/Users/falkar/Downloads/MicrosoftTeams-image%20(6).png
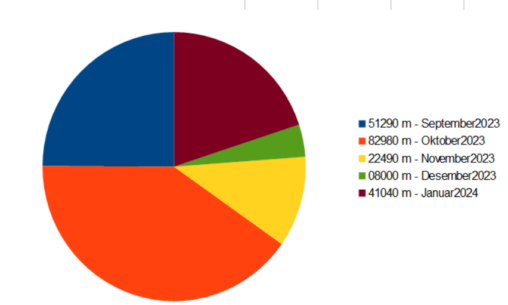
A pie diagram representing data stored for each month. The data depicts the distance jogged, (in meters) by Anonymous DIGI610 24V / Fantastiske Data Terje. The copyright status…

Antall minutter i saktegående bilkø på vei hjem fra jobb, mandag til fredag uke 7 i februar 2024.
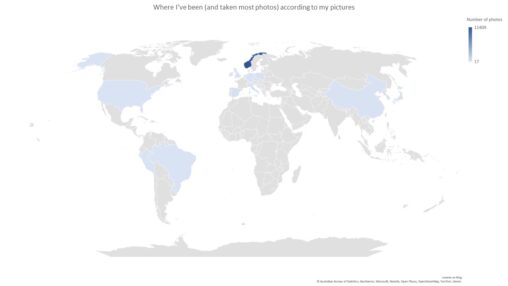
Where I’ve been according to my photo library. Visualized in Excel with my photo library as data source. Darker color indicates more visits,
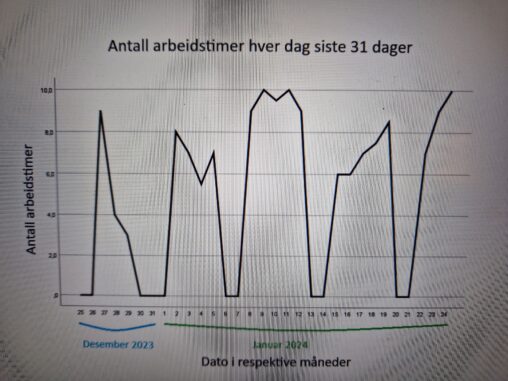
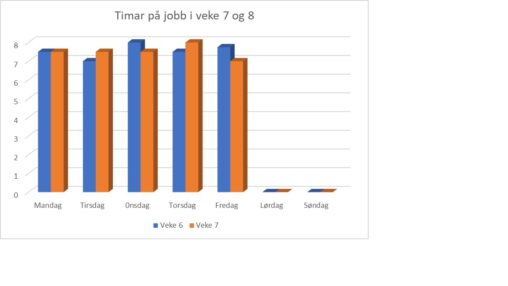
Mean work hours over the last 31 days Copyright: Jorunn Owner: Jorunn

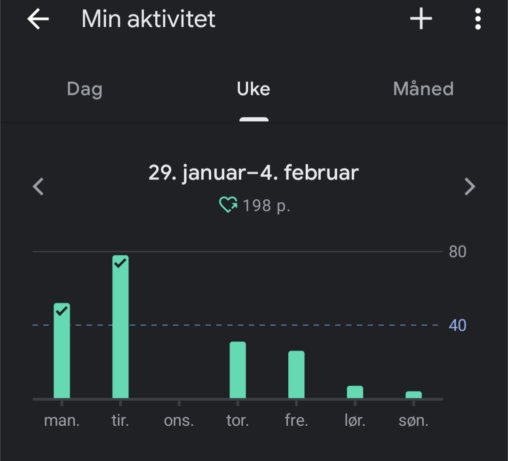
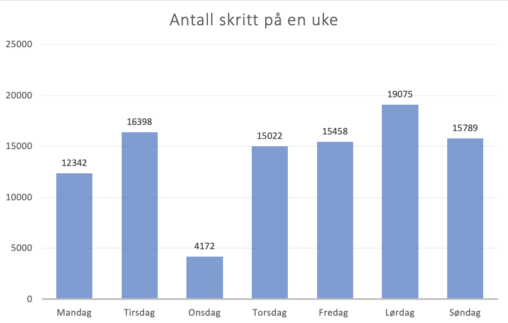
This Graph showes how many steps that are walked during the period of 29 of January to 4 of February. A week that was “slow” due to illness.
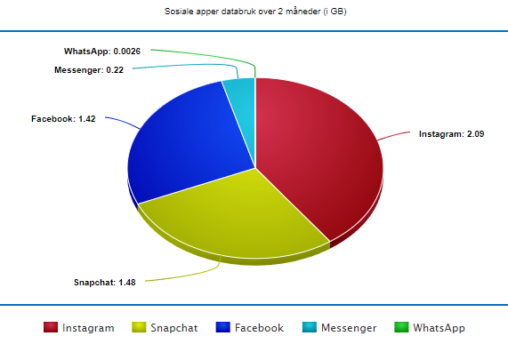
Databruk til sosiale medier apper på telefon (iPhone) over en 2 måneders periode. Angitt i antall GB.
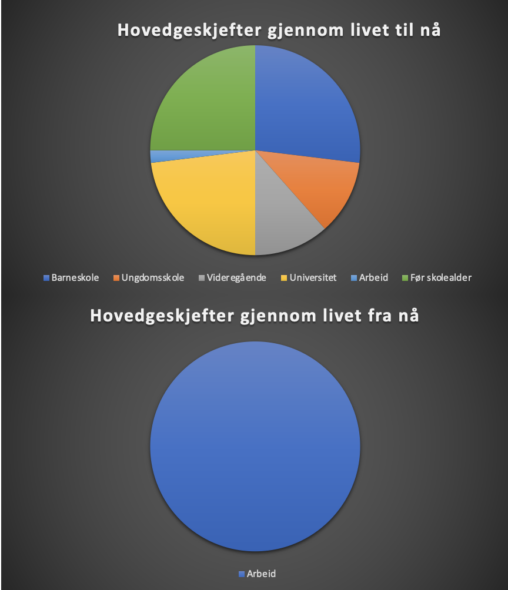
Dette er en visuell framstilling av hva hoveddelen av årene i livet mitt har gått til, og hva de resterende planlegges å brukes på.
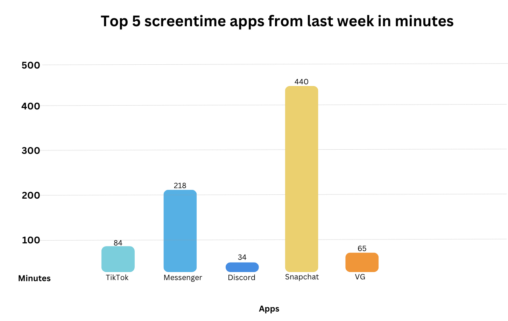
This bar chart shows my top 5 most used apps last week according to the screentime function on my iPhone. The numbers on the Y- axis shows minutes…
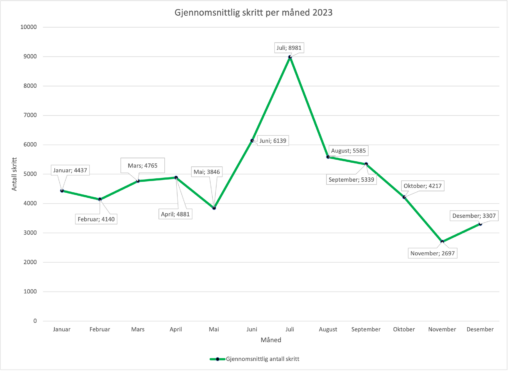
En graf som viser gjennomsnitt av antall skritt gått per måned i løpet av året 2023. Data hentet fra IOS Helse app på iPhone, og grafen laget i…