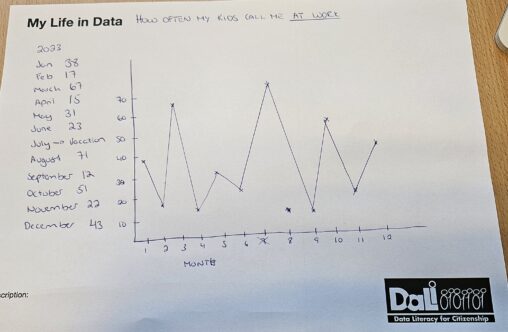
2077 Data visualizations Categorized "my life in data" (page 73 of 104)
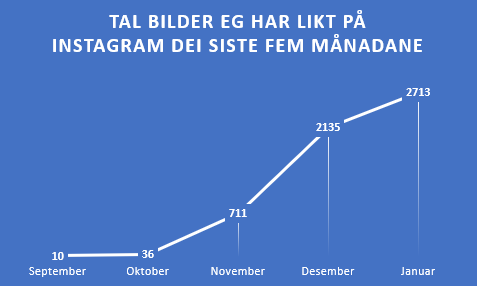
Auken i likeklikk viser eit ønske om å gjere noko under eit pågåande folkemord mot palestinarane. Tala er ikkje heilt riktige, sidan eg i ei periode ikkje fekk…

Jeg har foreløpig bare lest to av Rileys bøker, men har fire som venter.
The pic represents locations of vending machines that are sold and placed by an incredible team of people that I had the honor of to lead.
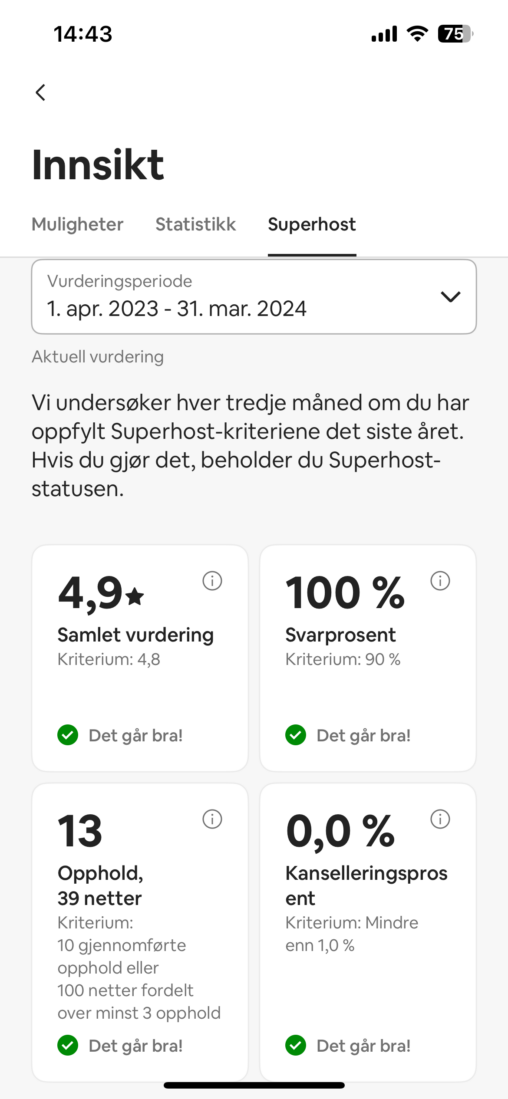
Ved å leie ut hytta blir jeg som utleier ratet av gjester. Får man gjennomsnittlig høy rating på flere ulike faktorer, kvalifiserer det til å bli Super-host. Det…


Data som sammenligner antall skritt gått i 2024, 2023 og 2022.
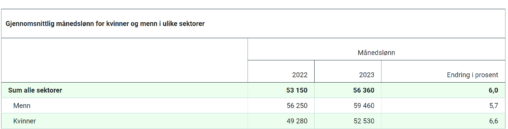
Dataene er hentet fra SSB lønnsstatistikk på ssb.no, og viser gjennomsnittlig månedslønn for kvinner og menn totalt i Norge for årene 2022 og 2023, og endringen i prosent…
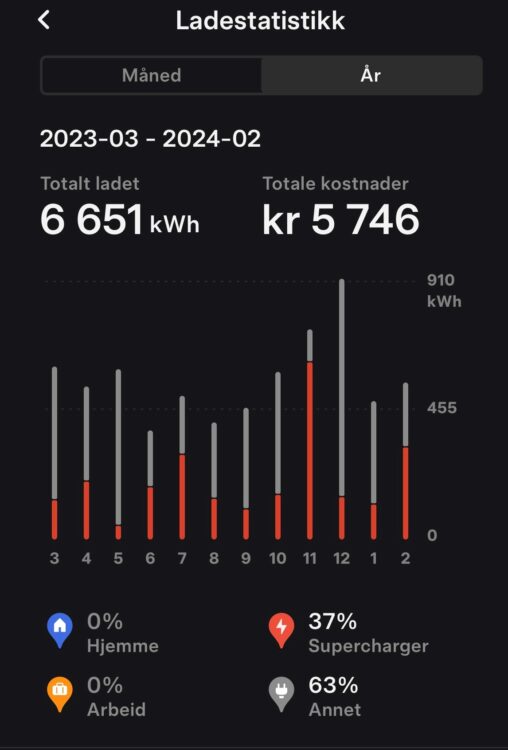
Picture shows my Teslas charging split between supercharging and normal charging.

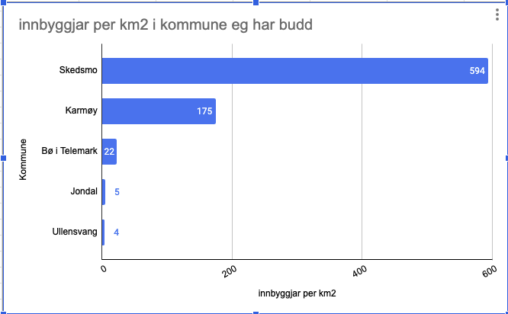
Innbyggjarar per km2 i kommunar eg har budd. Innbyggjartalet er tatt frå det året eg flytta. Statistikken er henta frå ssb.no og er offentleg.

All countries I have visited so far in my life highlighted on a world map. Source: App “been”
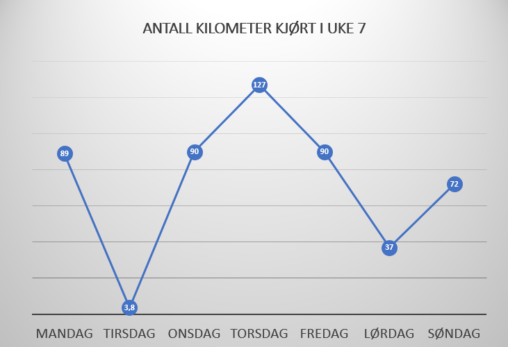
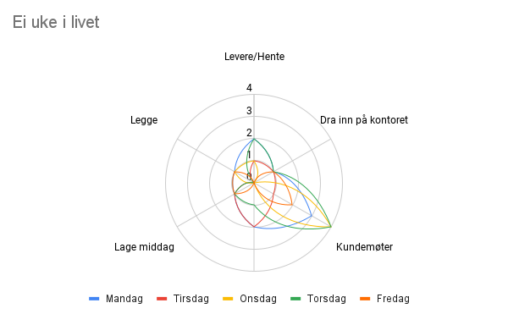
Visualisering av antall kilometer jeg har kjørt i egen bil fordelt på ukedager i uke 7. Antall kilometer hentet fra Google Maps som er lastet ned på egen…

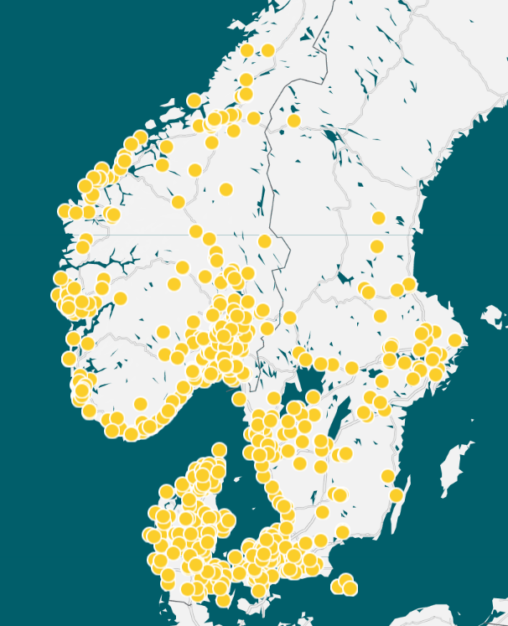
Kartet viser antall fotografier tatt i ulike deler av Norge. Dette er en visualisering av data fra min mobiltelefon (Iphone). Dataene er kun bilder, tatt av meg, på…
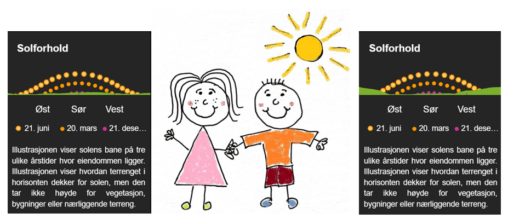
Min samboer og jeg deler en drøm om å eie vår egen hytte. Bosatt på regn- og vindfulle Vestland ønsker vi oss en hytte på andre siden av…