2077 Data visualizations Categorized "my life in data" (page 64 of 104)
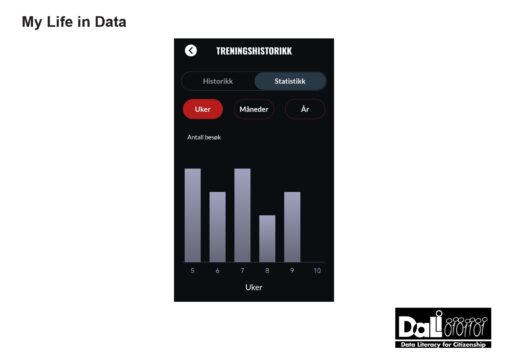
Antall treningsøkter pr uke vist som søylediagram fra appen som tilhører treningssenteret. Treningssenteret lagrer treningshistorikken og sletter denne automatisk slik at det bare er data fra de siste…
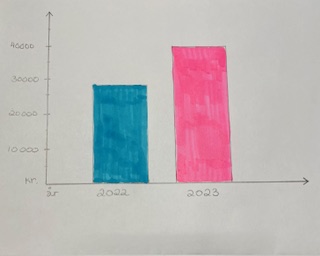
Grafen viser hvor mye min samboer og jeg har brukt på dagligvarer i året før barn i 2022 og etter vårt første barn som ble født januar 2023….
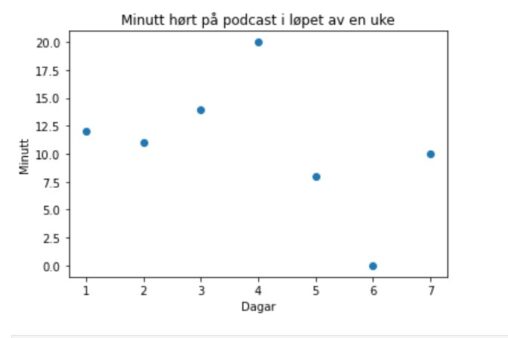
Scatter plot som viser hvor mange minutt jeg lyttet til podcast forrige uke.
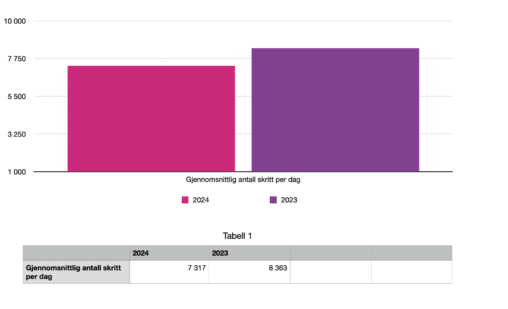
Diagrammet viser gjennomsnittlig antall skritt jeg har tatt per dag hittil i år versus i fjor. Dataene er samlet inn av min Apple Watch og hentet ut fra…
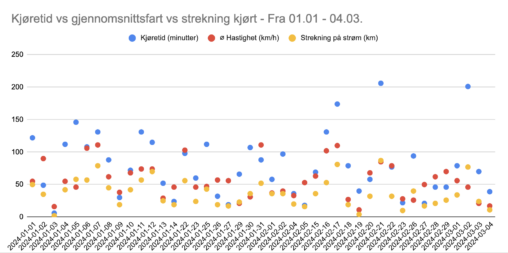
This graph intricately maps out the dynamic interplay between three pivotal dimensions of vehicular movement: the average speed at which a vehicle traverses, the total time spent in…

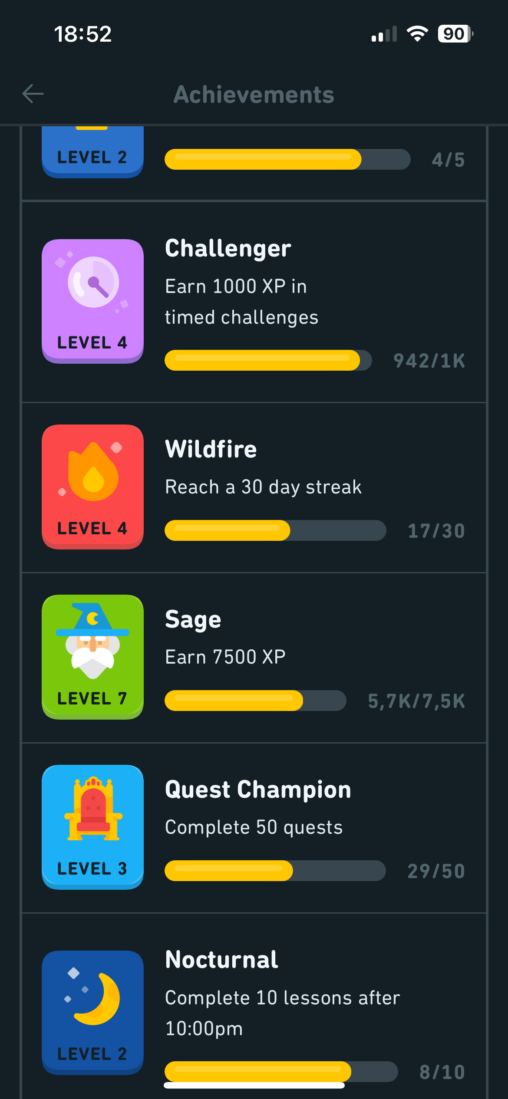
These are virtual achievements earned in the online game World of Warcraft, that I have been playing for some years. This snapshot is from one of my characters…

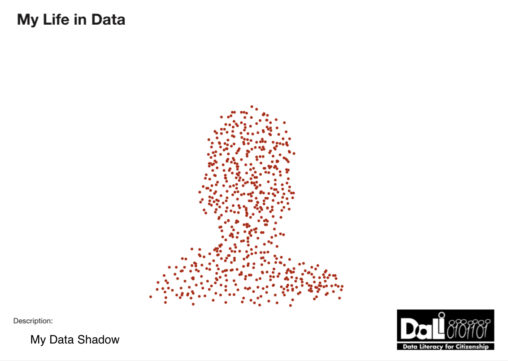
The things represented in this picture are items from every member of my family. The owner of the data is myself, chose to be anonymous.

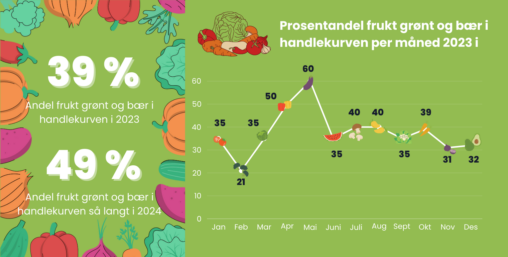
Grafen viser hvor stor prosentandel av maten jeg har handlet per måned i 2023 som er frukt, grønt og bær. Dataene er samlet inn via registrering av trumf,…
Grafen viser hvor stor prosentandel av maten jeg har handlet per måned i 2023 som er frukt, grønt og bær. Dataene er samlet inn via registrering av trumf,…

The number of books I’ve read in 2022 vs. the number of books I’ve read in 2023. Although the books I read in 2023 were mostly longer than…

Book covers as represented in Kindle’s mobile app for Iphone. Indication of newest books opened and read from my collection.
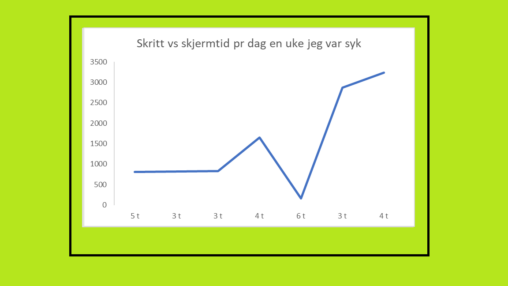
Graph showing steps per day vs screen time per day during a week of illness..

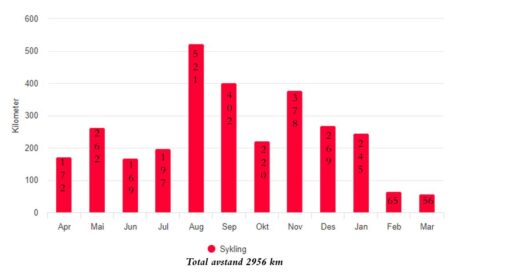
Brukte kalender, samt treningslogg via Strava app. Strava er eier av app som samler data.
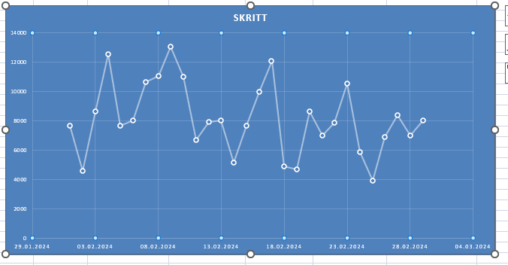

Gjennomsnittlig skritt per dag i februar 2024. Lastet ned fra appen “Apple Helse” – Helse og trening. Grafen viser hvilke 2 dager det var fint vær.