2077 Data visualizations Categorized "my life in data" (page 61 of 104)
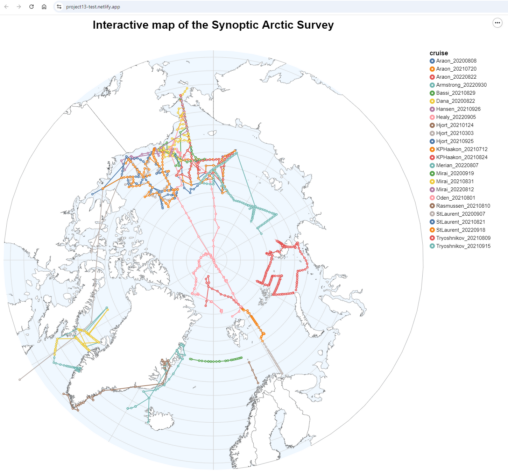
The development of an interactive map is part of my work as a project coordinator for the Synoptic Arctic Survey (SAS). Here is a snapshot of the current…
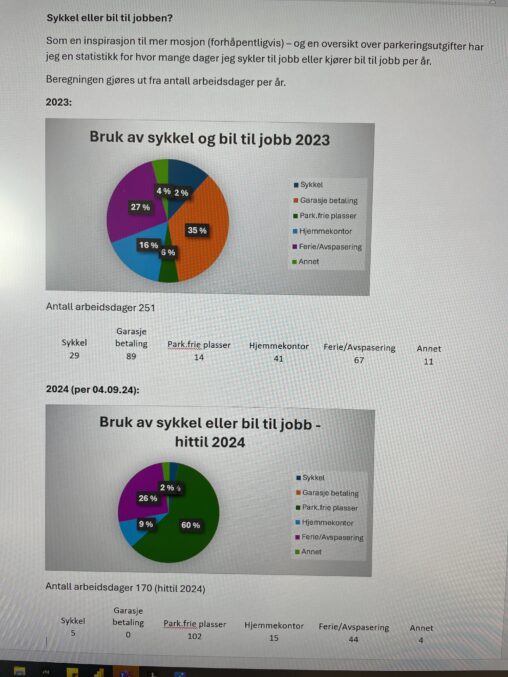
Grafisk fremstilling av statistikk for bruk av sykkel eller bil til jobb 2024 og 2023. text=bruk av sykkel eller bil til jobb

Grafisk fremstilling av en statistikk på bruk av sykkel og bil til jobb i 2023 og 2024
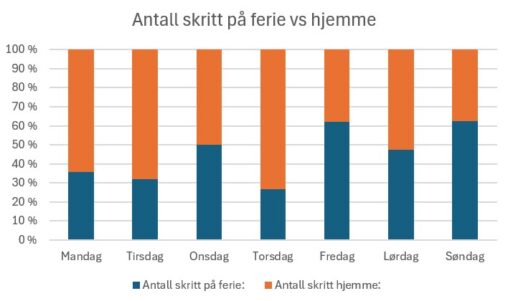
I denne dataen sammenligner jeg antall skritt daglig på ferie med når jeg er hjemme. Diagrammet viser en prosentvis fordeling mellom skrittene. Ferieperioden er 19.08 – 25.08, mens…
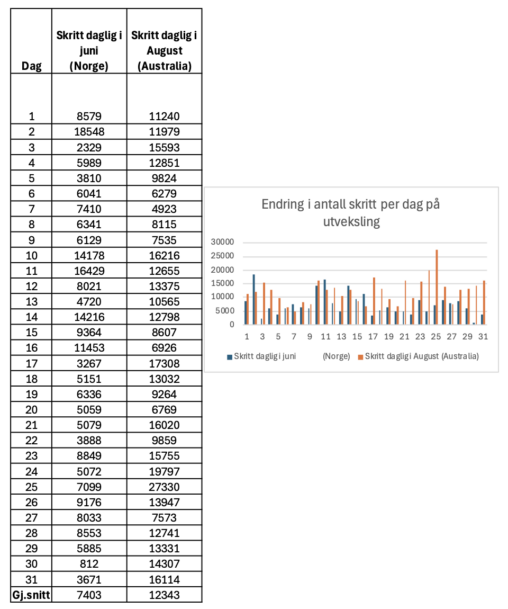
Sammenligner antall skritt daglig hver dag i juni, før jeg dro på utveklsing med antall skritt daglig i august mens jeg er på utveksling. Data er hentet fra…
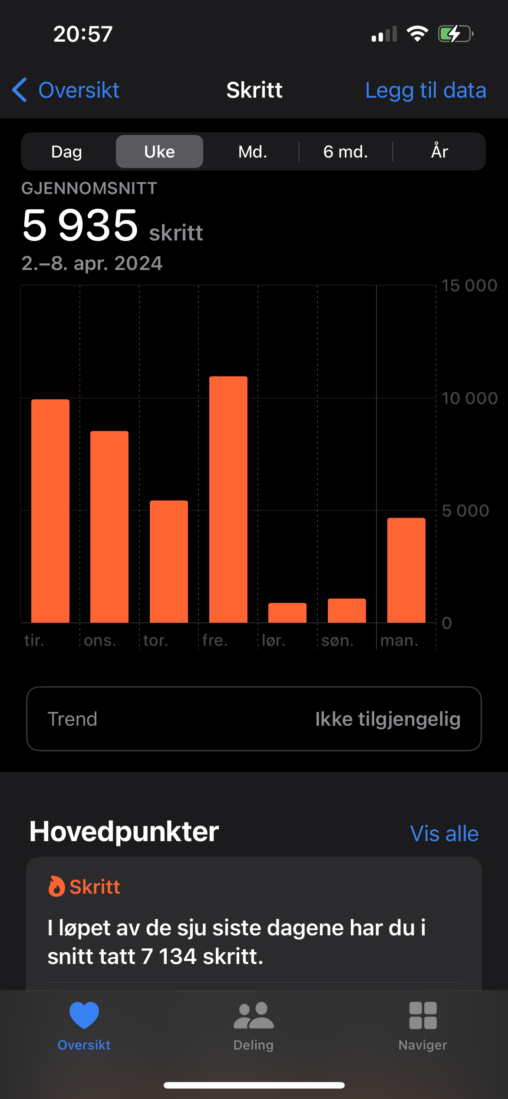
Dataen er hentet fra helse-appen på iPhone. Her har mobilen samlet inn data over hvor mange skritt per dag jeg går (forutsett at mobilen er med meg). Dette…
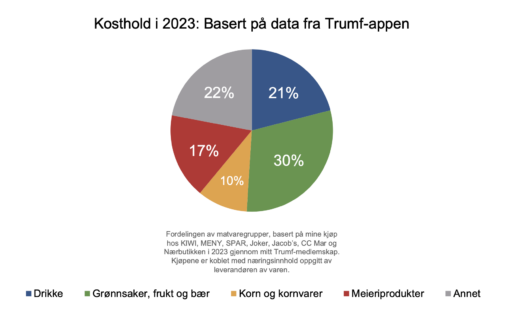
Fordelingen av matvaregrupper, basert på mine kjøp hos KIWI, MENY, SPAR, Joker, Jacob’s, CC Mar og Nærbutikken i 2023 gjennom mitt Trumf-medlemskap. Kjøpene er koblet med næringsinnhold oppgitt…
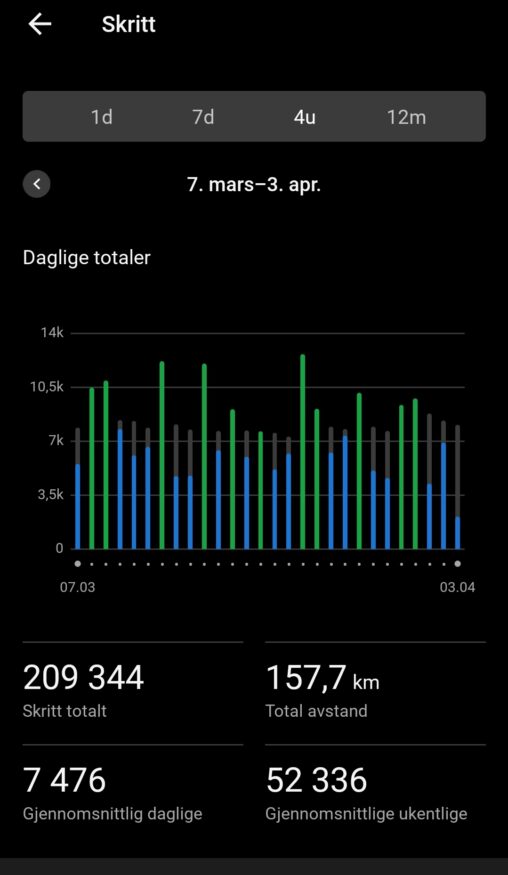
The image represent my steps for the last four weeks. As you can see I did not reach my goal in 17 of 28 days.
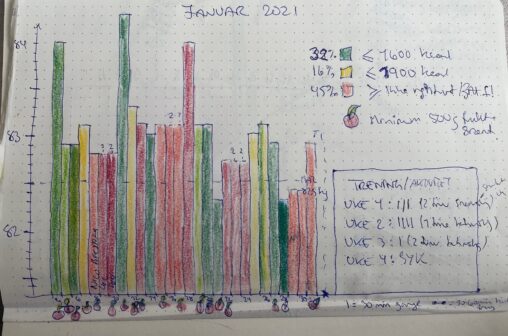
Daglig måling av vekt (kg) per dag (dato) i løpet av januar 2021. Farge på søylene er fargelagt etter kaloriinntak per dag beregnet i Roede-app. Grønt indikerer måloppnåelse…
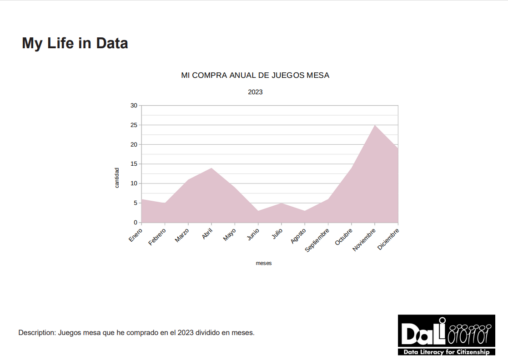
Compra de juegos de mesa que he realizado durante el 2023. No soy una empresa ni asociación sino una particular que le apasionan los juegos de mesa.
Fra min Iphone kan jeg se ev visualisering for hvor i Europa jeg har vært når jeg har brukt kameraet.
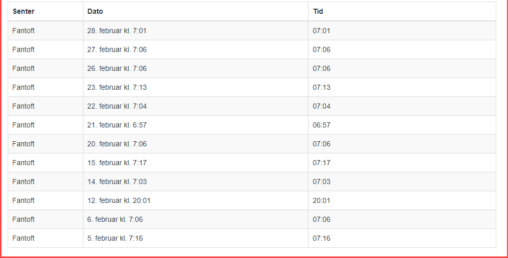
Inngangslogg på lokalt treningssenter. Viser sted, dato og tid. Hentet fra MinSide fra sammen trening.
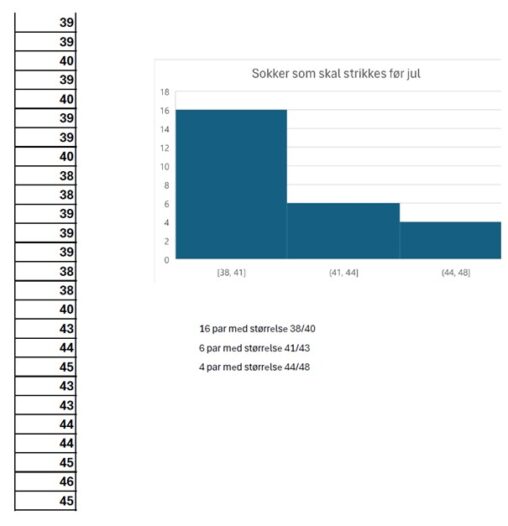
Jeg har satt meg ett mål om å strikke 26 par sokker innen 1. desember 2024


The image depicts the titles and images of games I have played the last two weeks. It also shows how many hours I have spent playing each game,…