
2076 Data visualizations Categorized "my life in data" (page 57 of 104)

Dette er en fremstilling av 4 forskjellige faktorer i mitt liv i perioden 01.09.2024 til 14.09.2024. Disse faktorene er antall skritt. Vekt målt i kilogram. og inntak av…

Her har jeg regnet ut antall minutter jeg har brukt i telefonen i løpet av uke 37 med mine venner og min familie. Det har blitt brukt fiktive…

Numbers and genres of unique episodes/movies watched on Netflix by myself since November 2023. Based on Netflix statistics for my user account.

the dates present my week, just the basics to see how much freetime I actually have. The project was made so I maybe could get a better picture…

Denne modellen viser min skjermtid på mobil i uke 37. Skjermtiden er oppgitt i minutter. Dataen er hentet fra mobilen min.

Comparing number of steps and precipitation during the day. Sunnier days gets more number of steps.

Denne grafen representerer endringer i antall timer søvn målt med Apple Watch fra april til september 2024. Dataene er samlet fra fredagsnatt til lørdagsmorgen, og viser tydelige svingninger…


Dette diagrammet viser hvor mange scam emails jeg har fått og antall elementer som har blitt observert i emailene, flere av disse som avslører fort at disse emailene…

Diagrammet viser daglig skjermtid på mobil (i minutter) fra 2. til 15. september 2024. X-aksen viser ukedagene, og Y-aksen viser skjermtid fra 0 til 160 minutter. Stolpene sammenligner…

En ørret fisket i Spåkevannet ble dissikert og undersøkt for parasitter. Fisken inneholdt cirka 60 fiskeandmakk kapsler av arten Dibothriocephalus ditremus på og rundt magesekken. Kapslene er 6-8…

Stolpediagrammet viser antall dager i utlandet det siste året, fra og med oktober 2023 til og med september 2024.

Tabellen viser potetkvalitet jeg fant da jeg laget potetstapp to fredager på rad. Flest poteter var fine og det var nok å skrelle dem (gruppe 1). Færre poteter…
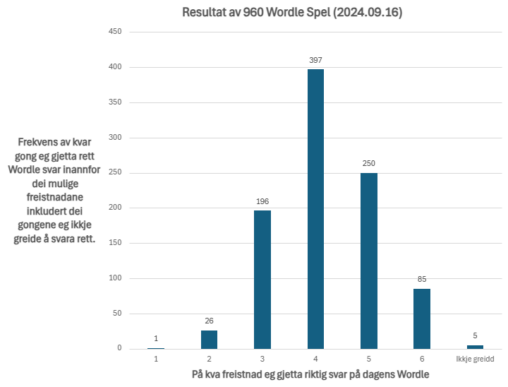
Visualisering av resultatene av 960 Wordle spel Søyle nummer 1 viser antall gonger eg gjetta riktig svar på første freistnad. Søyle nummer 2 viser antall gonger eg gjetta…

Between 02.09.24 and 06.09.24 I compared walking to my work place and using the light rail to my work place. The distance is from Kronstad to the city…
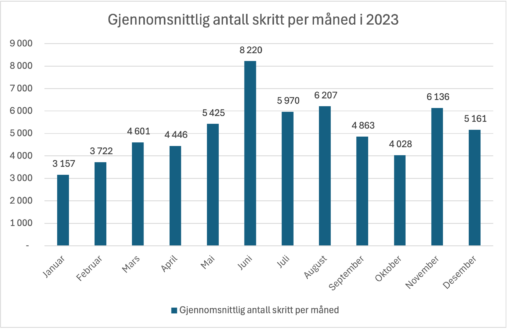
Gjennomsnittlig antall skritt per måned i 2023: Måneder i 2023 Januar Februar Mars April Mai Juni Juli August September Oktober November Desember Gjennomsnittlig antall skritt per måned 3…


Illustrasjonen viser inntak av overflødige kalorier i uke 36. Fargene angir type inntak

Copy of diagram from the Norwegian Bank visualizing the EURO currency rates per day in 2024, with the currency rate from 11.1. to 12.3 listed on the Y…