
2076 Data visualizations Categorized "my life in data" (page 55 of 104)
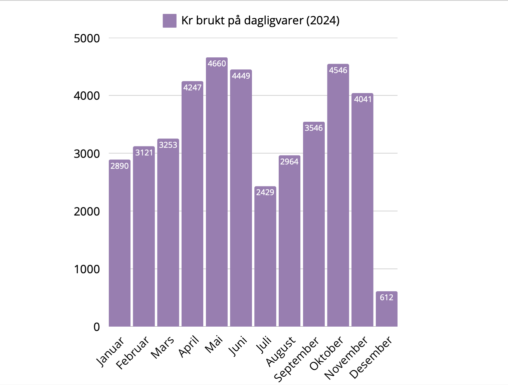
Et søylediagram laget i canva som viser en oversikt over hvor mange kroner jeg har brukt på dagligvarer hver måned i 2024.
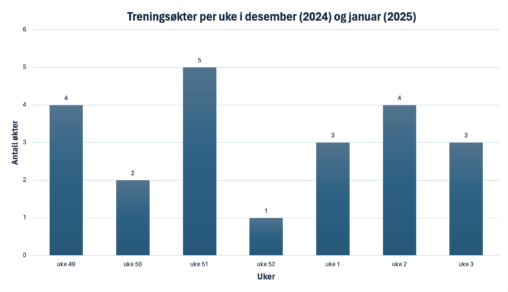
Stolpediagrammet viser en oversikt over hvor mange treningsøkter jeg har utført hver uke i desember og januar.
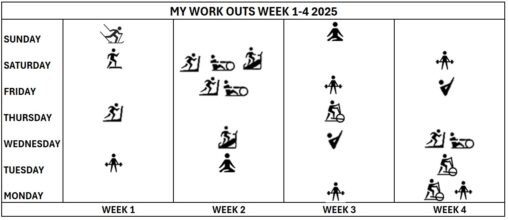
An overview over the different types of workouts I have done/will do in week 1-4 2025. I am the owner of the data represented, the illustrations for the…
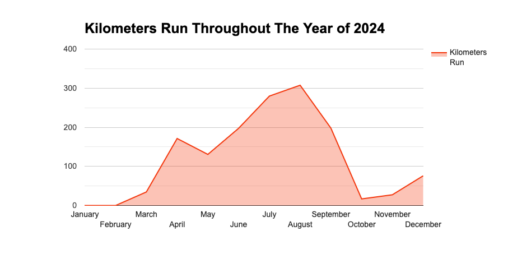
The representation in this picture is the distance I ran each month throughout the year of 2024, measured in kilometers.
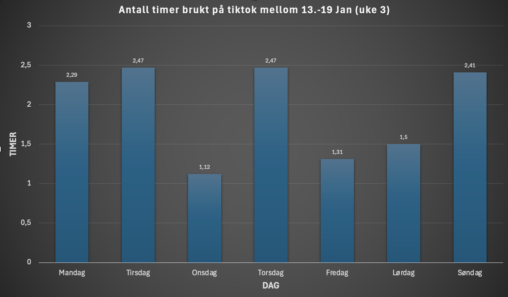
Bildet viser min tiktok bruk, regnet i timer pr dag, igjennom perioden 13.-19. Januar 2025. Søylediagrammet ble lagd ved bruk av Excel og informasjonen er funnet på telefonen…
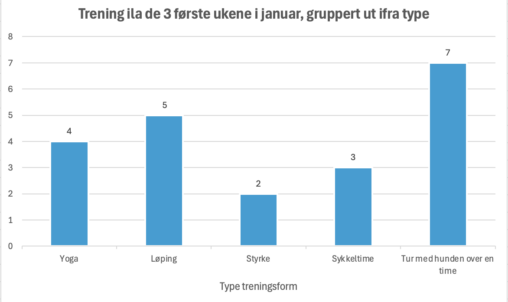
Stolpediagram som tar for seg antall ganger jeg har vært på trening i perioden de tre første ukene i januar 2025. Aksene tar for seg antall ganger vært…

Antall besøk jeg har hatt hos de forskjellige Sammen treningssenterene i Bergen fra 01.09.21 til 21.01.25
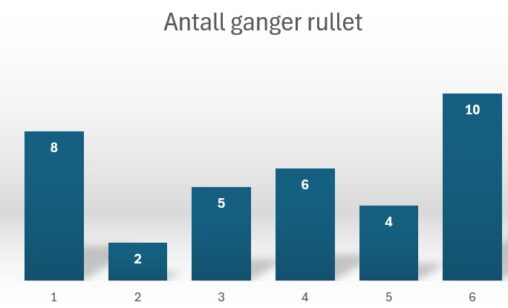
Diagrammet viser resultater av 35 kast med en terning, der hver stolpe representerer hvor mange ganger et bestemt tall (1 til 6) dukket opp.
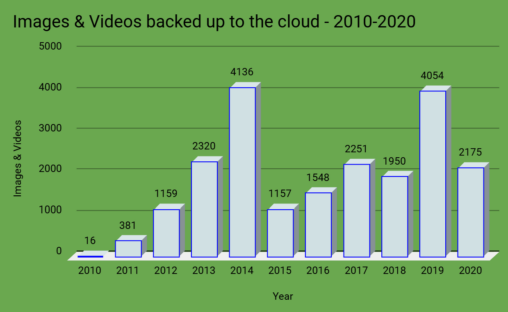
In 2010, I started automatically uploading all my photos and videos to Dropbox from my phone. Since then, the amount of images I’ve taken has increased dramatically. It’s…
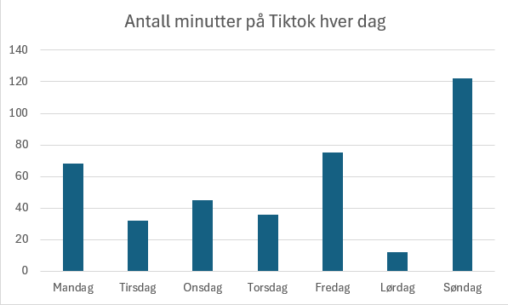
Dette viser en oversikt over antall minutter brukt på den populære plattformen Tiktok i løpet av en uke.
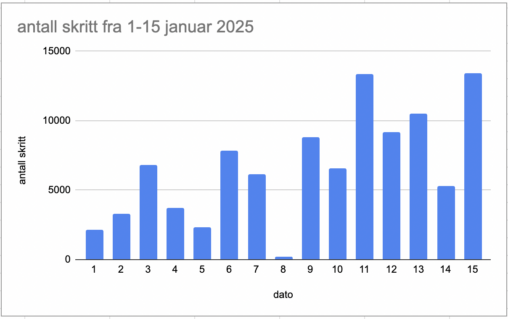
diagrammet viser en oversikten over antall skritt tatt mellom første og femtende januar 2025.
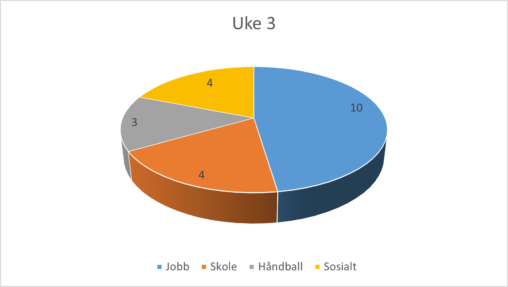
Figuren representerer tidsbruken min (antall timer) i uke 3 fordelt på aktiviteter jeg holder/holdt på med.
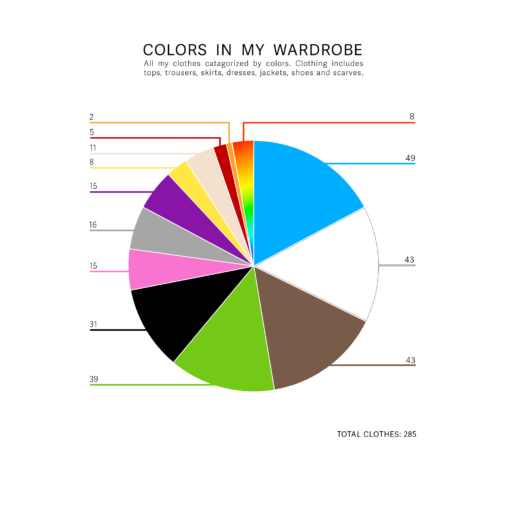
Et sektordiagram som kategoriserer mine egne klær etter farge. Klærne inkluderer topper, bukser, skjørt, kjoler, jakker, sko og skjerf – totalt 285 plagg. Diagrammet er fremstilt i en…
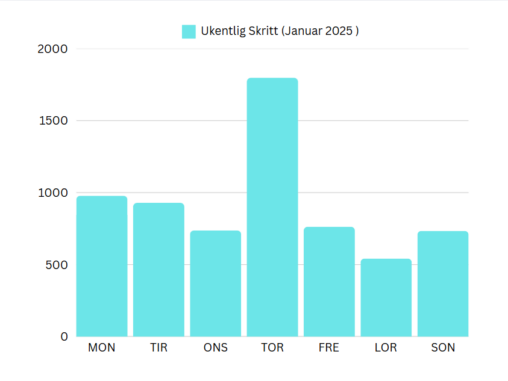
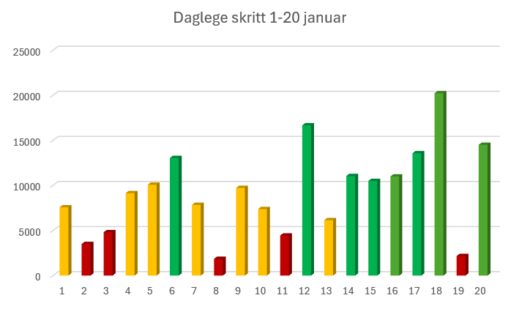
Bildet viser ukentlig skritttelling for den første uken i 2025, der Y-aksen representerer antall skritt og X-aksen viser de syv dagene i uken. Dataene visualiserer daglige skritt, og…
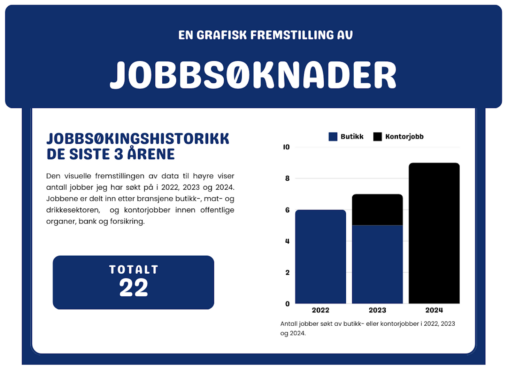
Den visuelle fremstillingen av dataen over viser antall jobber jeg har søkt på i 2022, 2023 og 2024. Jobbene er delt inn etter butikk og kontorjobber. Nederst på…
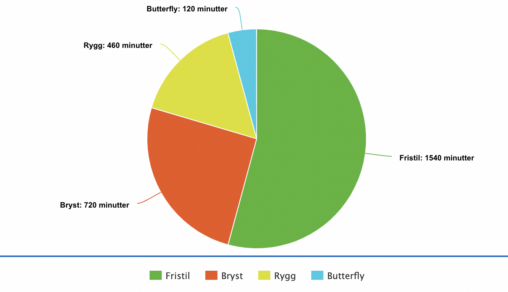
Bildet viser et sektordiagram av de ulike svømmeteknikkene jeg har benyttet i antall minutter som en nybegynner innen svømming det siste halvåret. Teknikkene i datasettet er fristil, butterfly,…
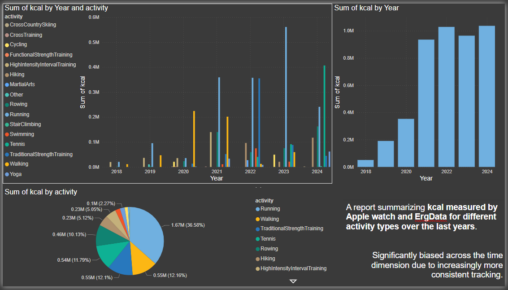
A report summarizing kcal measured by Apple watch and ErgData for different activity types over the last years. Significantly biased across the time dimension due to increasingly more…