
2077 Data visualizations Categorized "my life in data" (page 53 of 104)
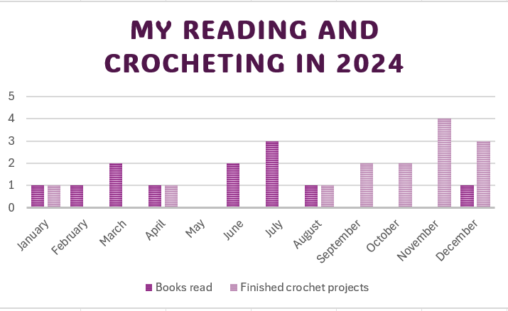
Reading and crocheting are some of my favourite hobbies. This diagram is representing how many books I have read and how many crochet projects I have finished every…

Dataene i dette søylediagrammet viser oversikt over hvor mange dager per uke i 2025 jeg har spist på restauranter og laget middag hjemme. Dataene gjelder fra 01.01.2025 –…
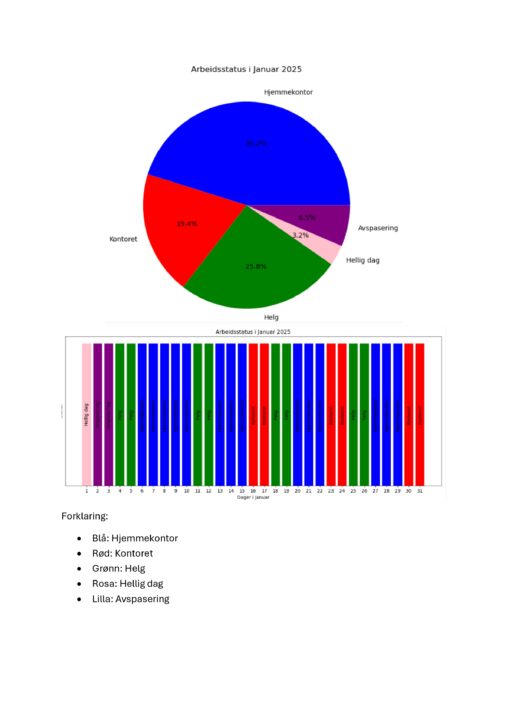
Søylediagrammet viser arbeidsstatus og arbeidsplass for hver dag i januar 2025: -Blå søyler representerer dager med hjemmekontor (mandag til onsdag, samt 9. og 10. januar). -Rød søyler representerer…
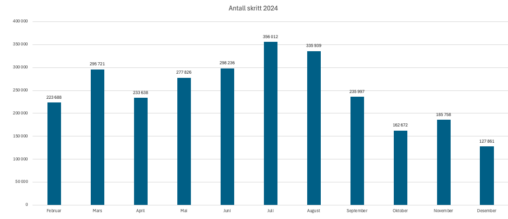
Denne dataen kommer fra pulsklokken min fra Garmin, som samlet inn informasjon om hvor mange skritt jeg har gått hver dag, og gjør det tilgjengelig i app. Det…
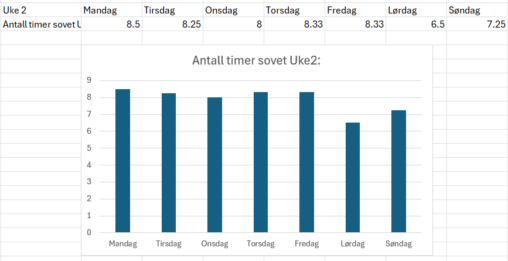
This diagram shows how my sleep varied for the second week of 2025. Note that on Saturday(lørdag) I was out drinking, which heavily affected my sleep in.
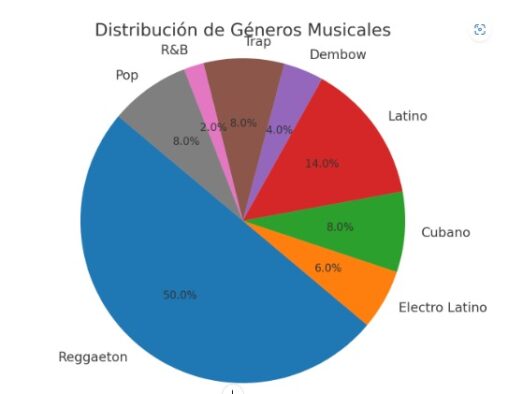
I love music, I spend most of the time listening to it, so I decided to do a diagram about the genres from my daily playlist. We can…

In this three graphics I’ve presented myself, as an active, classic and funny person, represented with my steps, my clothes and my leisure.
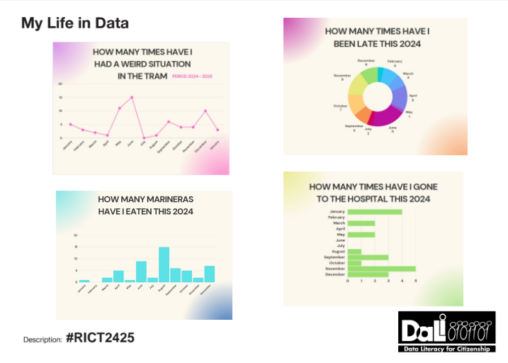
There are 4 graphics that represent: – How many times have I had a weird situation in the tram: these situations can vary from a weird encounter to…
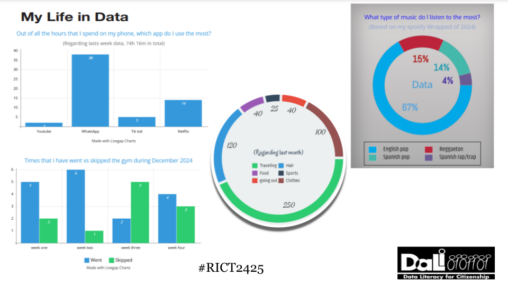
The four diagrams give information about: 1. How much time do I spend on each App in my phone?. 2. How many days do I go or skip…

Top 5: combat It is something I enjoy doing sometimes, but since at my club it is taken very seriously and I am not as good as my…

Oversikt over hvor mange dager med trening, hvor mange dager fri, samt hvilken type trening jeg har gjennomført i januar 2025. PS: Beregnet til og med 23. januar.
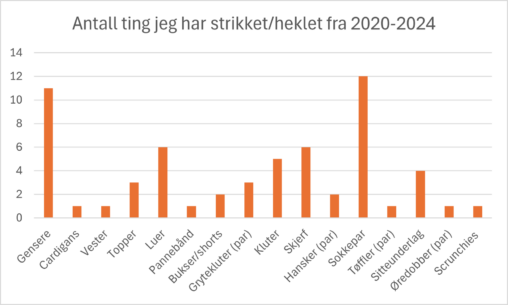
En oversikt over hvor mye av ulike ting jeg har strikket eller heklet mellom 2020 og 2024.
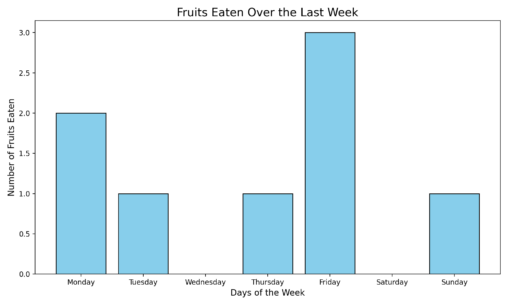
This graphic shows the times I have eaten fruit last week. On monday I ate two pieces of fruit, on tuesday one piece of fruit, on wednesday no…
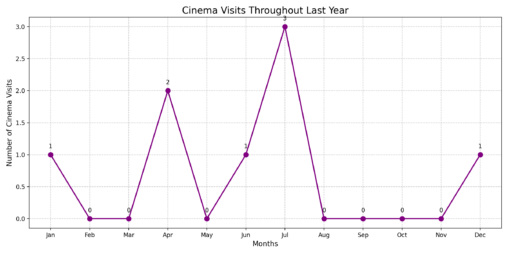
The graphic shows the times I went to the cinema last year. I´ve been one time in jenuary, cero times in february, cero times in march, in april…
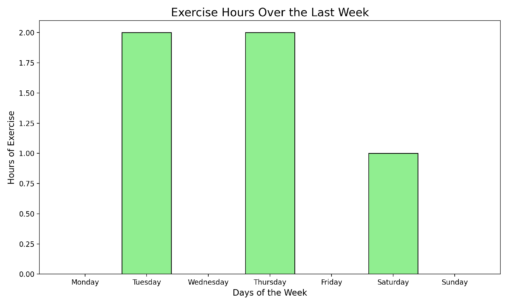
This graphic shows that i didn´t exercise last monday any hours, tuesday two hours, wednesday no hours, thursday two hours, friday 0 hours, saturday 1 hour and sunday…
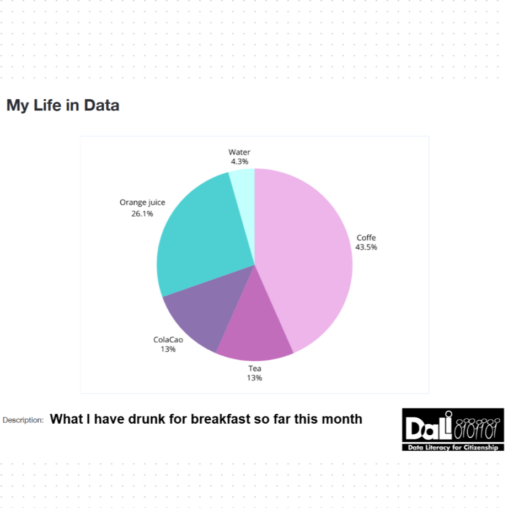
This graphic shows the percentage of how much coffee, tea, ColaCao, orange juice and water I have drunk for breakfast so far this month. This way it visually…
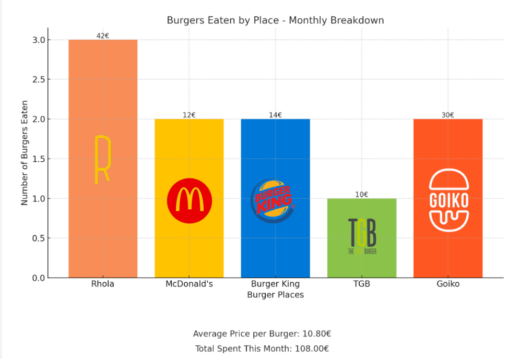
This month’s burger obsession has been fully documented in a glorious graph: the total number of burgers devoured (spoiler: it’s a lot) versus the ultimate favorite of the…
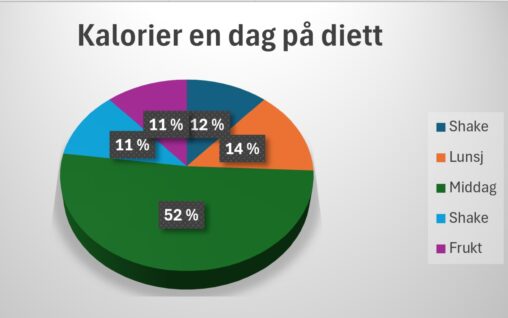
Dette diagrammet viser hvor stor prosendel, målt i kalorier, hvert måltid har en dag på dietten min. Dette var torsdag 23.1.25. Dataene er mine.