
2097 Data visualizations Categorized "my life in data" (page 5 of 105)

I’ve collected data from my Garmin-watch and made a vizualisation of the hours I was awake from 16-22 of February 2026
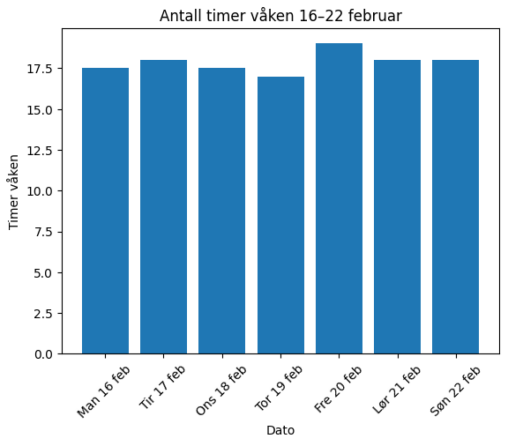
I have vizualied how many hours I was awake from 16-22 february 2026. I used data from my Garmin watch
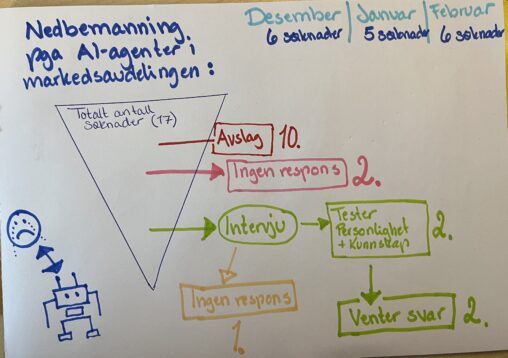
Beskrivelse av visualiseringen Visualiseringen viser min jobbsøkerprosess fra desember 2025 til februar 2026. Bakgrunnen er nedbemanning på grunn av AI-automatisering. Bildet følger 17 prosesser (enheter) fra kilder som…
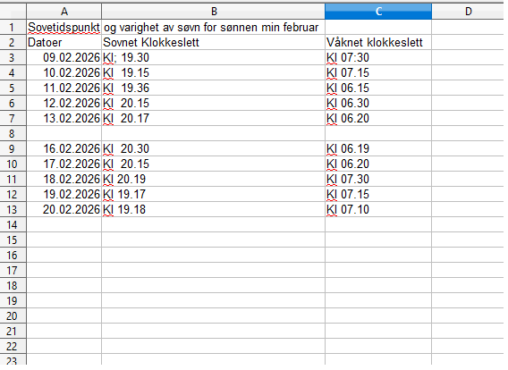
Her ser dere tidspunkter for når min sønn på 4 år sovnet noen dager i februar og når han sto opp. Ville se om han sto litt senere…
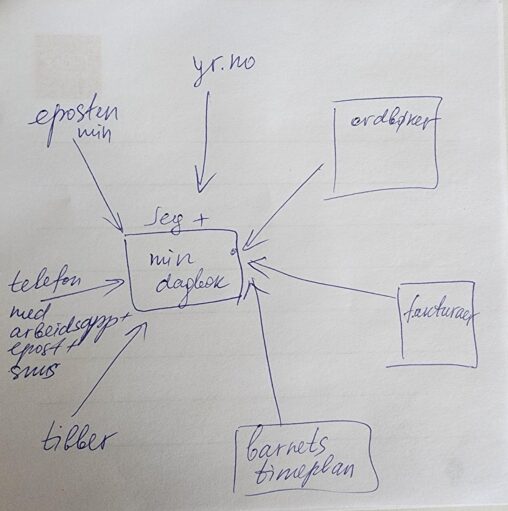
Min dagbok er i sentrum av mitt liv. Alt i mitt liv knyttet til data oppført enten i dagbok eller i telefon. Eller både og.
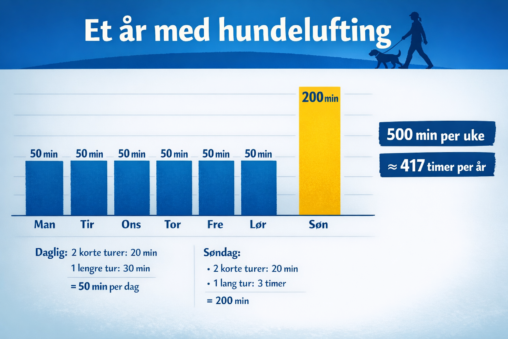
My one year walking the dog, hours anually spent. Put all my data into ChatGPT, promted it to make an visualization
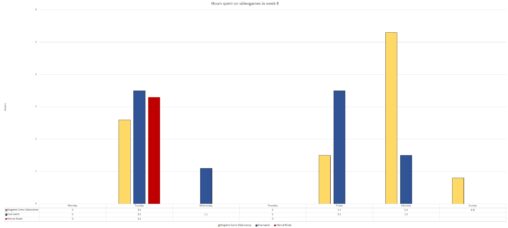
The grahs visualize the hours i have spent on different videogames throughout week 8. The unit of measurement is hours. Every coulured bar represent one of the games…
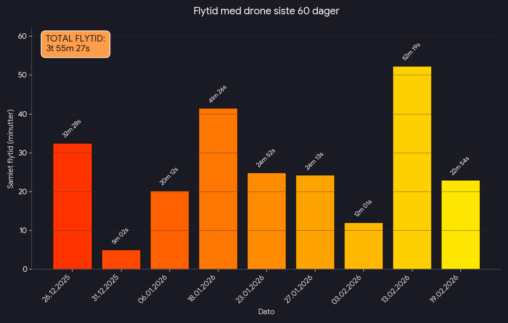
Grafen viser samlet flytid med pr dag i løpet av en 60-dagers periode. Samlet flytid for hele perioden viser også.
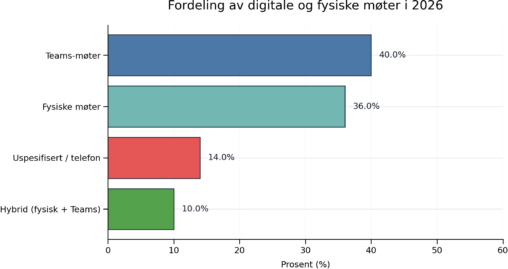
Stolpediagrammet viser andelen av kalenderhendelsene mine fordelt på møtetyper i 2026 fra 1. januar til 22. februar. X‑aksen representerer prosentandel av møter (%) og Y‑aksen viser de fire…
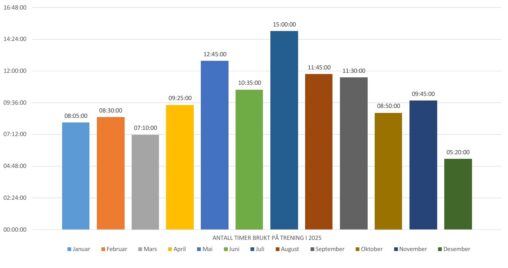
The data presentation provides a complete monthly overview of time spent exercising throughout 2025. It is based on my personal data from a fitness app.
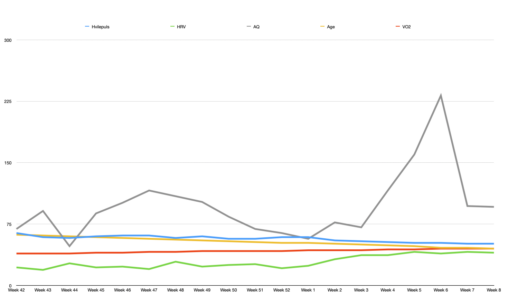
Data fra uke 42 (2025) til uke 8 (2026) Snitt for uken, eller verdi i slutten av uken. Hvilepuls (hjerteslag i minuttet) mellom 51 og 64 HRV (Puls…
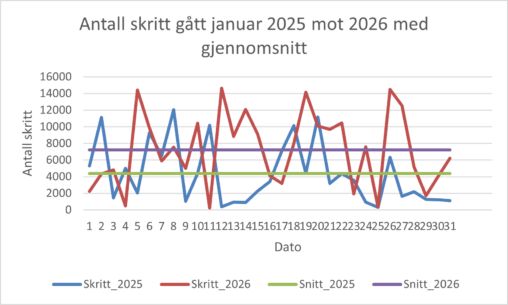
Visualisert fremstilling av antall skritt gått i januar 2025 mot januar 2026 med markering av gjennomsnitt. Det vises antall skritt på y- akse og x.akse viser dato. Det…
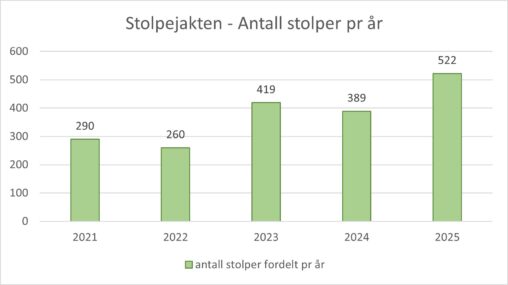
Dette er en oversikt over alle stolpene jeg har funnet de 5 årene jeg har vært med på stolpejakten, fordelt på kalenderår. Stolpejakt er en slags uformell turorientering,…
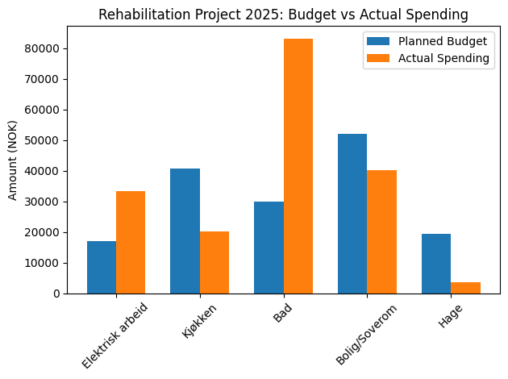
A rehabilitation project in 2025 was planned for my apartment with a fixed budget.The project was divided into five areas: Electrical work Kitchen Bathroom Bedroom/Interior Garden The goal…
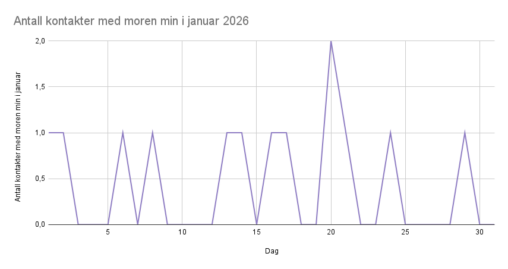
Jeg ville vite hvor ofte jeg ville ringe moren min, som bor i et annet land, i januar 2026.
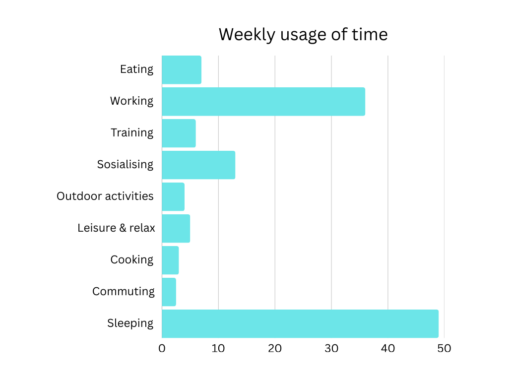
[link url=”https://www.canva.com/design/DAHCEmBUm2Y/q9tI3vXxlZ6gn_qEqbtudw/edit?utm_content=DAHCEmBUm2Y&utm_campaign=designshare&utm_medium=link2&utm_source=sharebutton” text=”Weekly report of time”
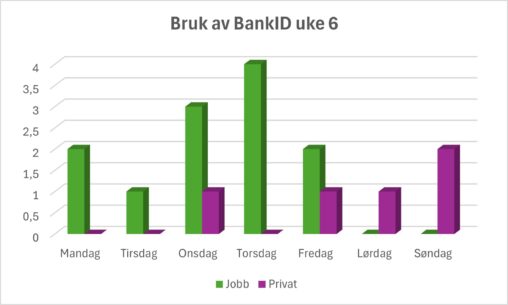
Grafen illustrerer hvor ofte jeg har brukt BankID for å utføre oppgaver i uke 6 i år. Oppgavene er skilt på private gjøremål og jobbrelaterte aktiviteter.
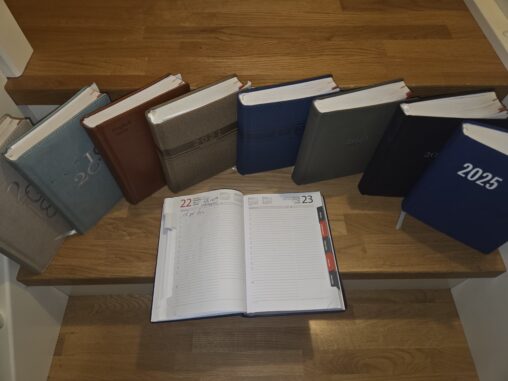
Kvart år tilbake til 2006(ikkje vist i bilete) har min sambuar og eg ført dagbok for det daglege arbeidet i garden som vi driv. Dette er vikitg data…
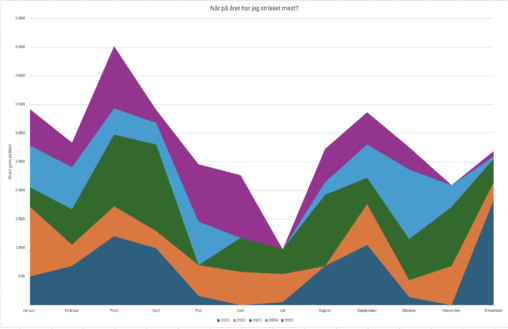
Har samlet data over ferdigstilte strikkeprosjekter i løpet av de siste 5 årene og ville se på om det var perioder i året jeg har strikket mer enn…
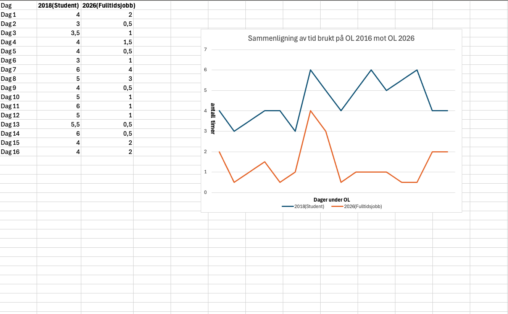
This visualization shows an approximate comparison of the number of hours I spent watching the 2018 and 2026 Olympic Games, measured in hours for each edition of the…