
2107 Data visualizations Categorized "my life in data" (page 47 of 106)
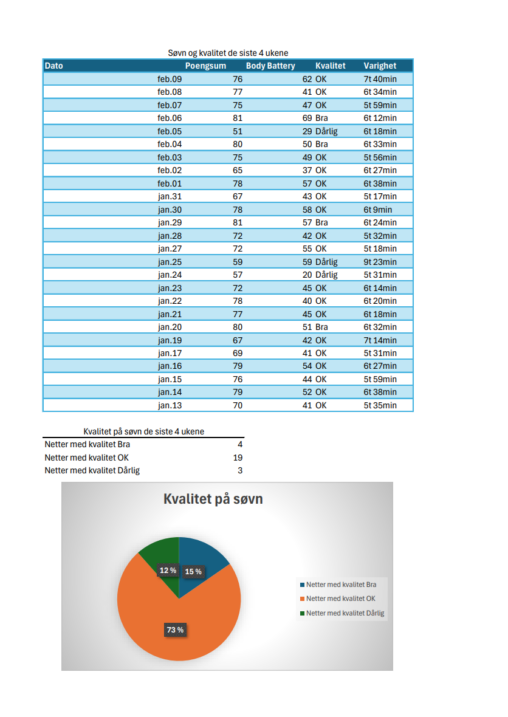
Hvilken kvalitet søvnen min har hatt de siste 4 ukene. Data som er brukt er hentet ut fra en smart klokke, Garmin Venu2. Data er fordelt på ulike…
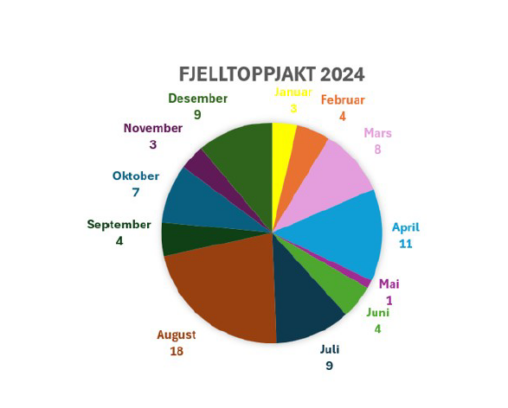
Er mye på tur og da brukes appen “Fjelltoppjakten”, bildet viser mine resultat fra 2024 – fordelt på mnd
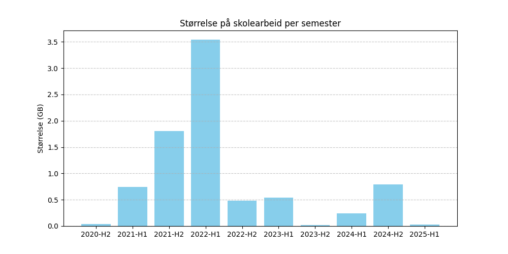
Søylediagram som viser størrelsen på mitt skolearbeid fordelt på ulike semestre.
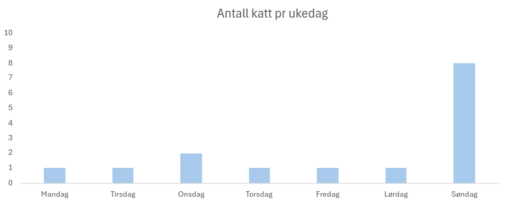
Har brukt excel til å kartlegge hvor mange katter jeg ser daglig i en uke. Dette blir også en tilnærmet lik datainnsamling for når jeg er hos svigers….
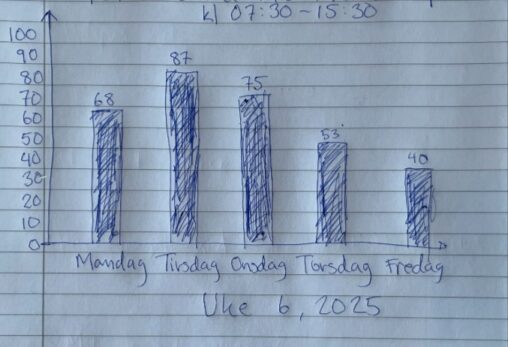
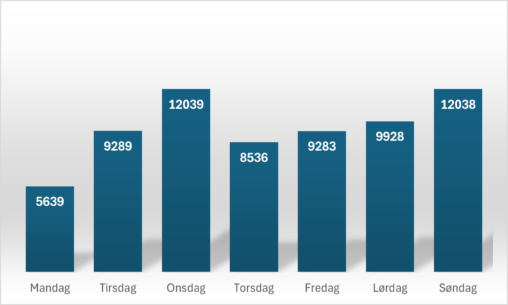
Innkommende e-poster fra kl 7.30 til 15:30 mandag til fredag.
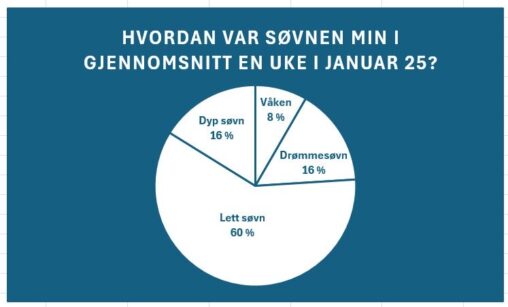
Datavisualiseringen viser egne søvndata (i prosent) for en uke i januar 25 (gjennomsnitt) kategorisert i søvnstadier. Søvnen varierer i kvalitet gjennom natten og visualiseringer fordelt på stadier kan…
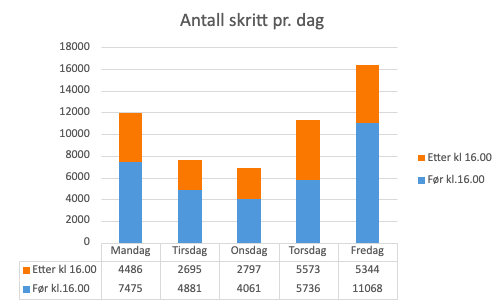
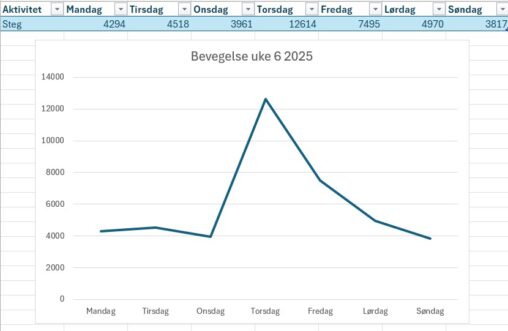
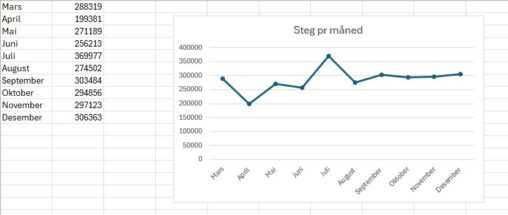
Oversikt over antall skritt pr. dag på morgenen og jobb (før kl.16.00), og fritid/kveld (etter kl. 16.00). Data fra uke 6 i februar.
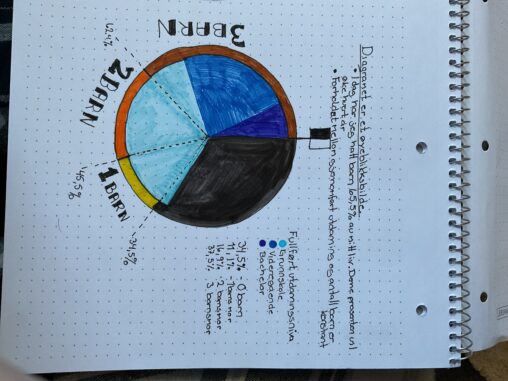
visualisering er et øyeblikksbilde. For hver dag som går vil den delen av diagrammet som viser at jeg er trebarnsmor øke i størrelse på bekostning av de tre…
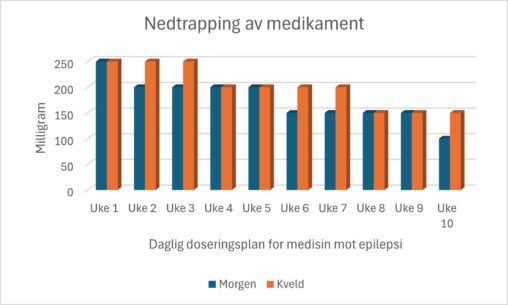
Diagrammet viser min gradvise nedtrapping av den daglige doseringen på en type medisin, som etter legen sin plan til slutt skal fases helt ut.
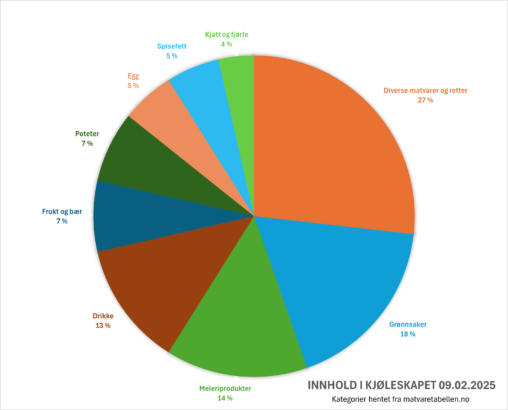
Categories are from matvaretabellen.no as public domain. All other data is my own. The diagram contains data of my refrigerator content on February 2nd, 2025. The data in…
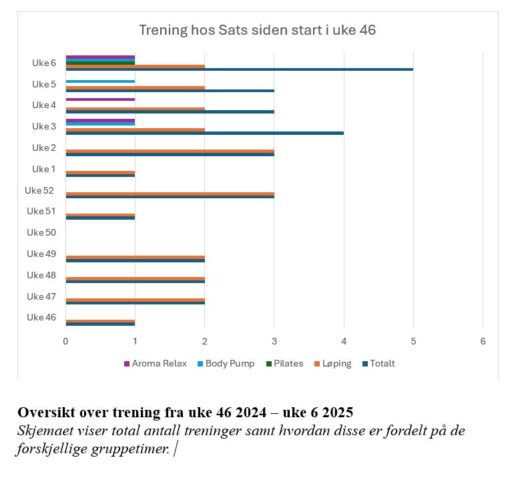
Bildet viser oversikt over treningen siden jeg startet opp hos SATS i uke 46. Det viser total antall timer per uke og hvilke type gruppetimer som ble gjennomført.
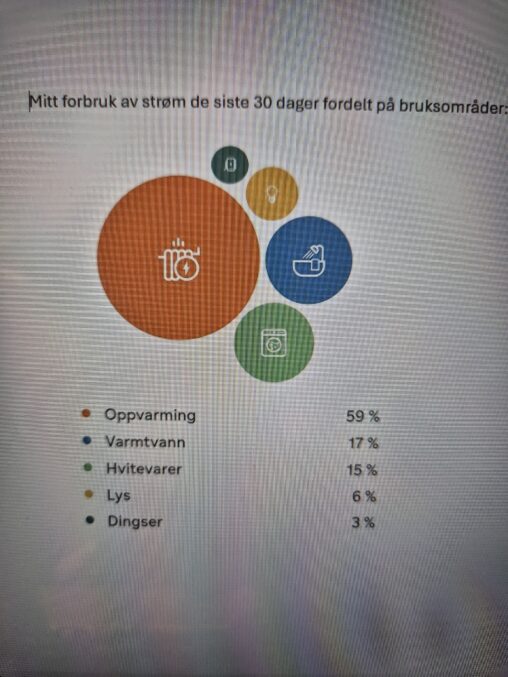
Størrelsene på figurene og bildene viser fordeling av forbruk av strøm inndelt i 6 områder, der oppvarming er klart størst. Dingser er lading av f.eks. nettbrett og mobil.
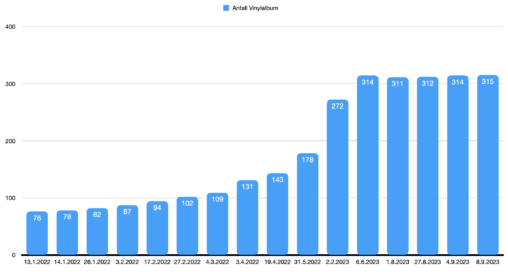
Søylediagram som viser hvor mange album vinylsamlingen min økte med fra Januar 2022 til September 2023 i tilfeldige intervaller.
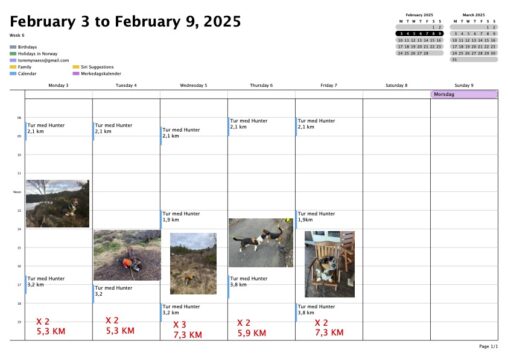
This image cover one week of walks with my dog Hunter. It shows how many trips per day and how long each trip was. I also put in…
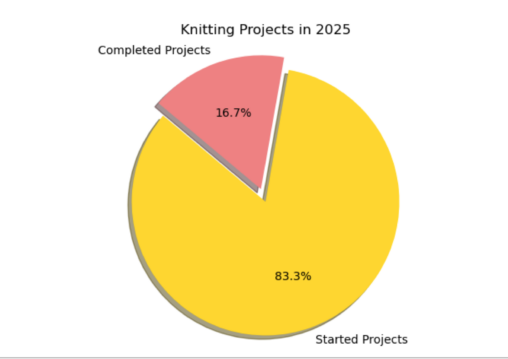
Dette er et diagram som viser at jeg har påbegynt 5 strikkeprosjekter i 2025. Av de 5 er det 1 som er ferdigstilt.
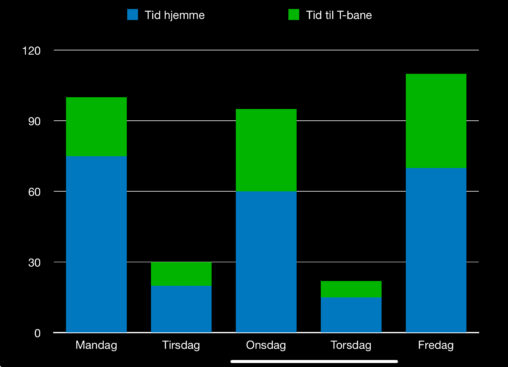
Viser at tid hjemme og tid til T-bane varierte mellom under 30 min til 110 min. Det er public domain. Jeg eier dataen.