
2107 Data visualizations Categorized "my life in data" (page 4 of 106)
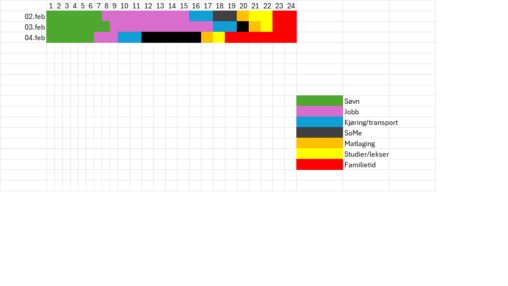
The chart showes how I spend my time over 3 days. Sleeping, working, driving, SoMe, cooking, school/homework and time with family.
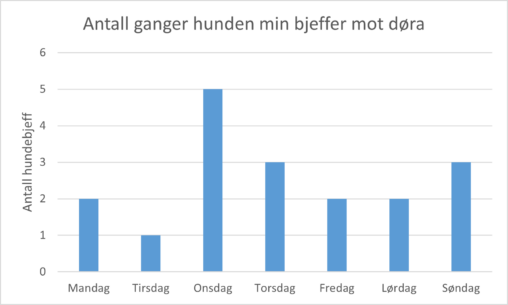
The data visualization shows how many times per day my dog barked at the door last week. I registered the data.
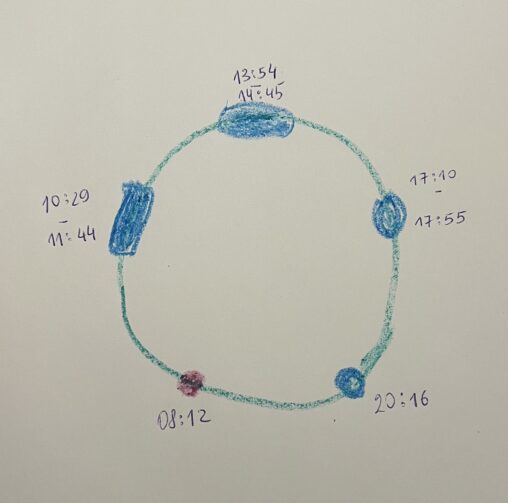
The data shows a typical day with sleep and awake windows of a four months old baby. He/she started the day at 8.12, and proceeded with three naps,…
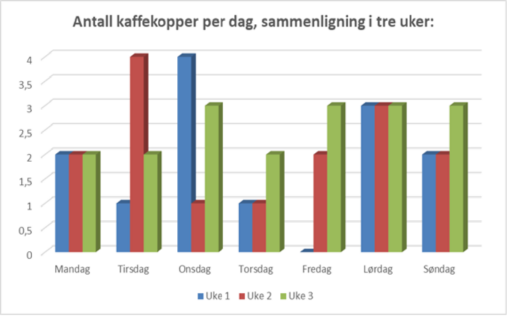
This data shows how many cups of coffee I drank every day in three weeks in the winter of 2026.
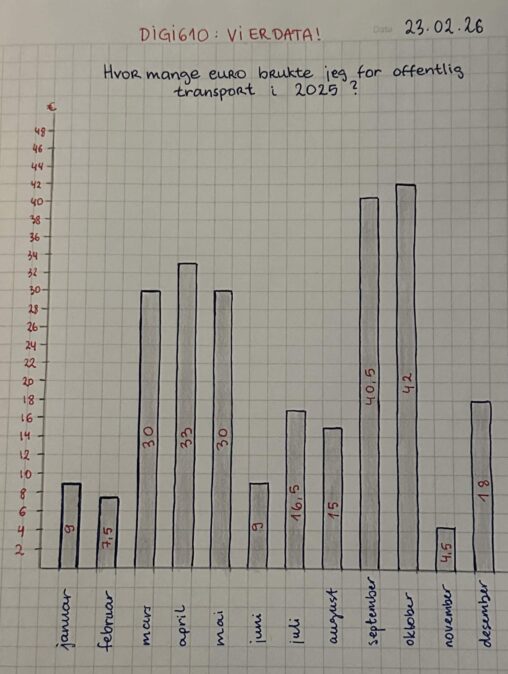
Y axis being euros, X axis being months of the year, I present how much money I have spent on public transport in year 2025. Data is all…
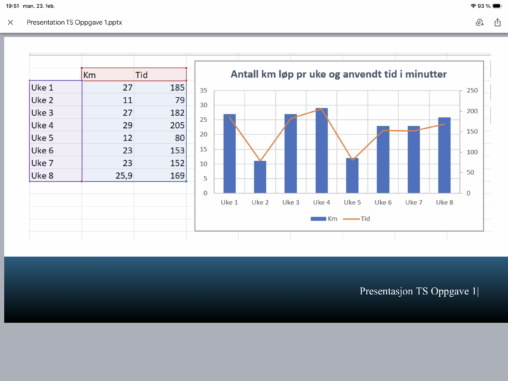
Visualisation of my running workouts done in Oslo the 8 first weeks of 2026. Amount of km run and how much time I have spend on my running…
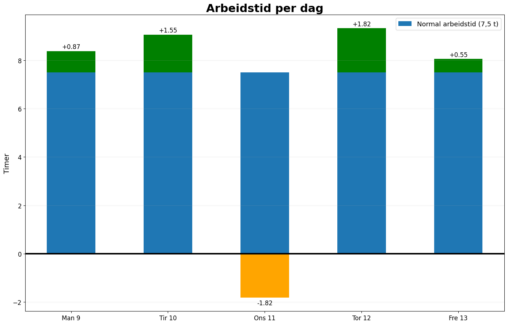
Visualiseringen viser antall timer jeg har jobbet i uke 7, mandag til fredag. Normal arbeidstid (7,5 t) i blå, positiv fleksitid i grønn, og negativ fleksitid under null…
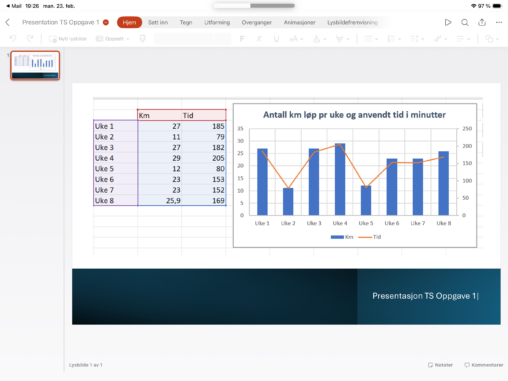
Visualisation of my running exercises during the first weeks of 2026. This is (part of) my life in figures.
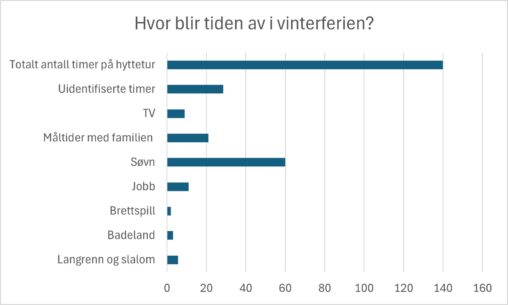
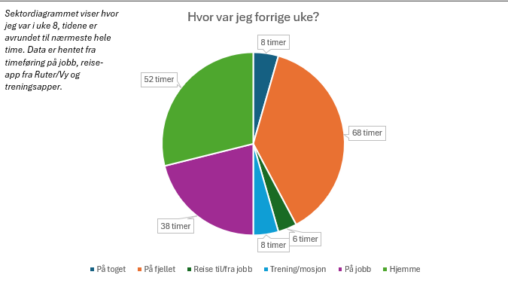
Diagrammet viser hvor totalt 140 timer på hyttetur i vinterferien blir av, med ankomst kl 7 fredag kveld, og avreise kl 15 torsdag ettermiddag. Dataene er skrevet i…
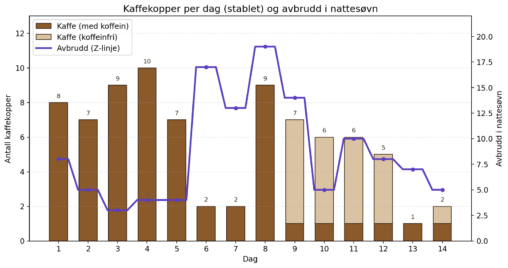
Oversikten viser antall kaffekopper, med og uten koffein, som ble drukket i en 14 dags periode, og antall oppvåkninger i løpet av nettene i samme periode, for å…
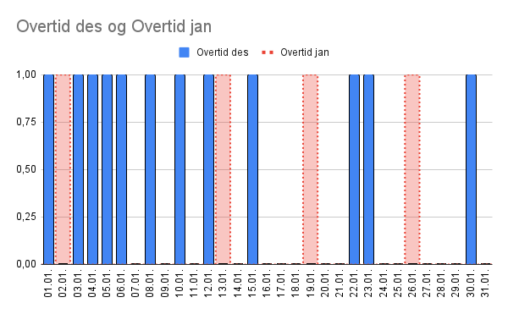
Hvor mange dager i mnd hvor jeg har måtte jobbe overtid. Dette viser ikke antall timer, bare hvor mange dager jeg har måtte stå utover min opprinnelige tid.
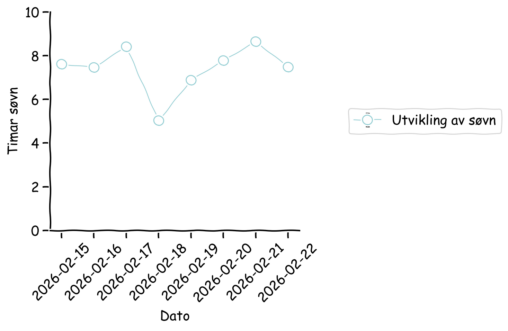
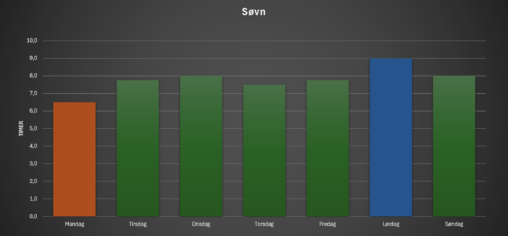
This line chart shows my personal sleep duration over the past week. The x-axis represents the date (2026-02-15 to 2026-02-22), and the y-axis shows hours of sleep per…
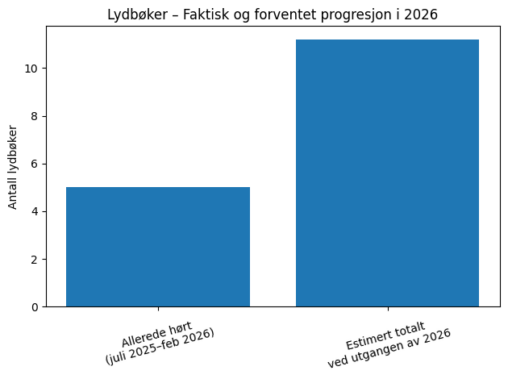
This is the data of number of books I’ve listened to with NRK “Leseklubben” from July 2025 to February 2026. This includes an estimate of how many books…
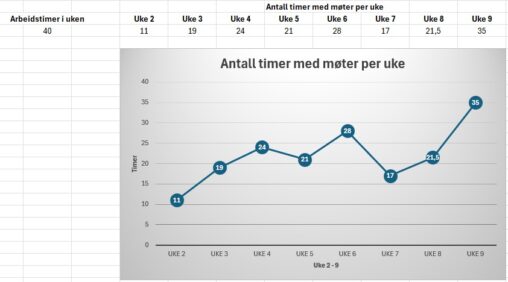
I’ve made this visualization based on how many hour’s I’ve spendt in a meeting each work week since the new year. The units are in hour’s and weeks….
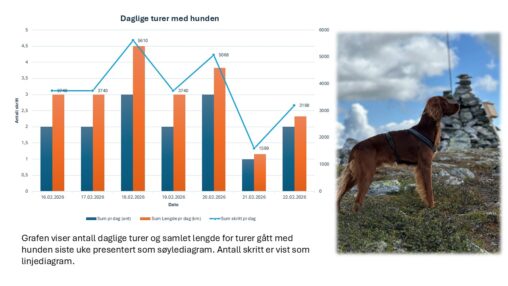
Grafen viser antall turer jeg har gjennomført med min hund i uke 8 (16-22 februar). Som stolpediagram vises antall daglige turer og antall kilometer. Som linjediagram vises antall…
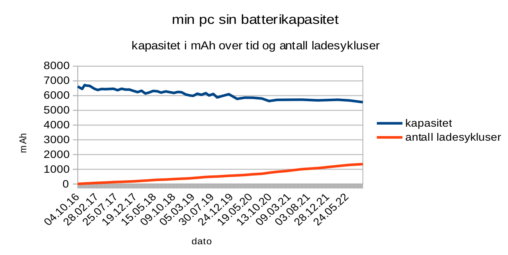
Utviklingen i min pc sin batterikapasitet fra den var ny over en bruksperiode av over flere år og 1200+ ladesykluser. Jeg eier dataene og har brukt LibreOffice til…