
2104 Data visualizations Categorized "my life in data" (page 34 of 106)
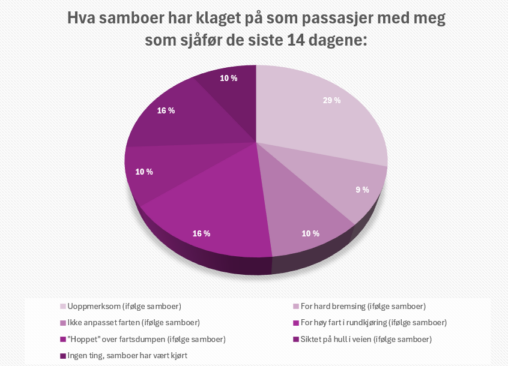
Illustrasjon av hva min samboer klager på som passasjer med meg som sjåfør. Tar resultatene til meg, men merk: Jeg har hatt førerkort i 12 år, kjørt skadefritt…
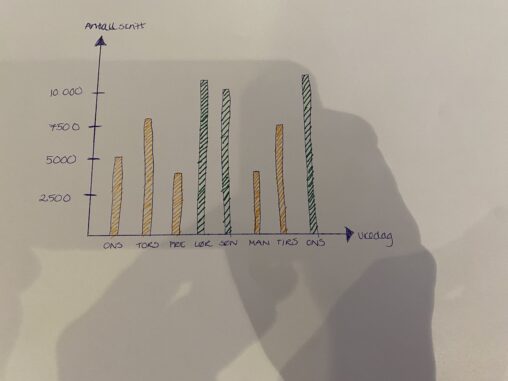
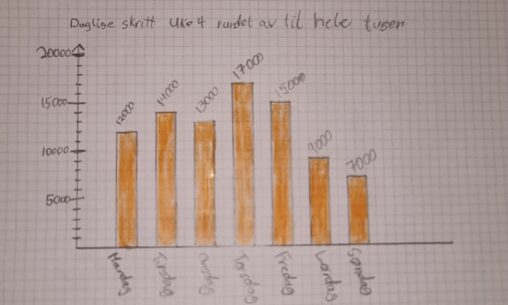
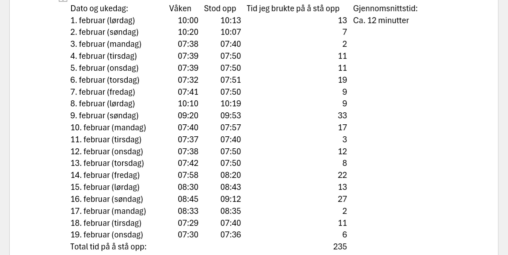
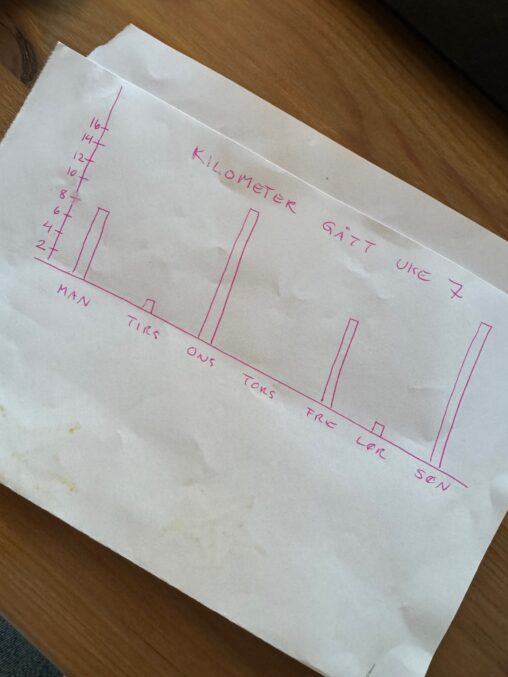
Daily steps for the last 8 days. My goal is 10.000, so the days i have reached my goal are represented by a column.
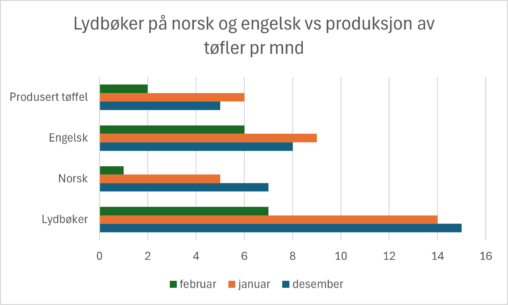
Antall lydbøker, sortert på norsk og engelsk, lyttet til des-24 – feb-25 og antall strikketøfler produsert i samme tidsrom. Eier: H Lunde
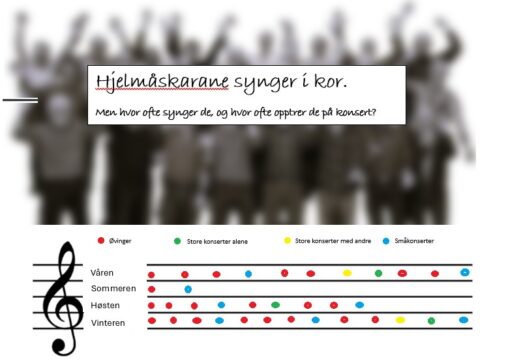
Hjelmåskarane er et trivselskor med base på Hjelmås i Alver kommune like nord for Bergen. Bildet representerer aktiviteten til koret gjennom et normalår. Detaljene viser den periodiske rytmen…
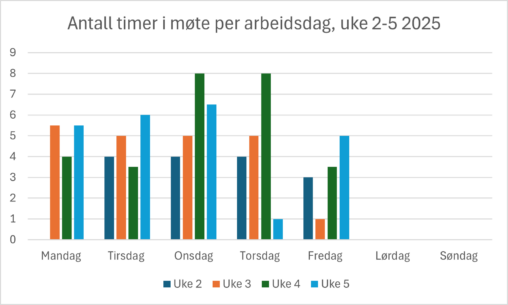
Hours in meetings per workday. Data is from my Outlook calendar and is visualized in Excel.
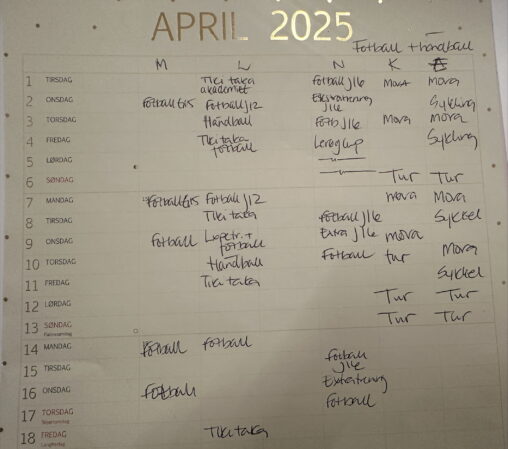
This is a normal week in our family for activities like Football and handball for the 3 kids, and exercising like hiking and gym for the adults.
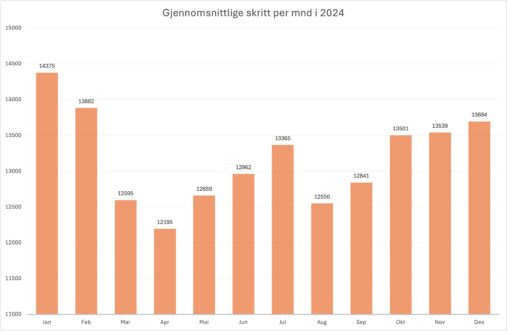
Gjennomsnittlige skritt per mnd i 2024 registrert på apple watch og iphone.
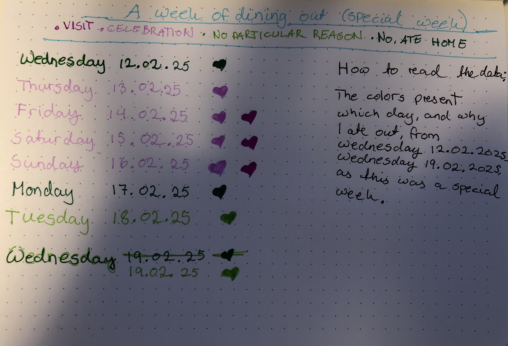
My life in data: It was a special week with: One finished an exam, got visit, and theater concert, therefore it has been a lot of celebration dinners….
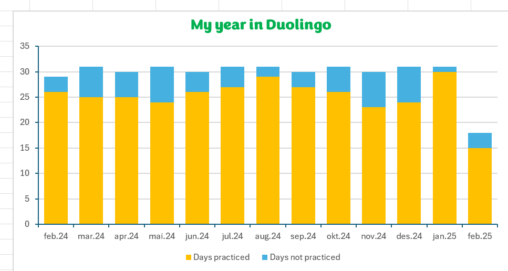
Chart showing how many days I used Duolingo over about a year, 01.02.2024-19.02.2025
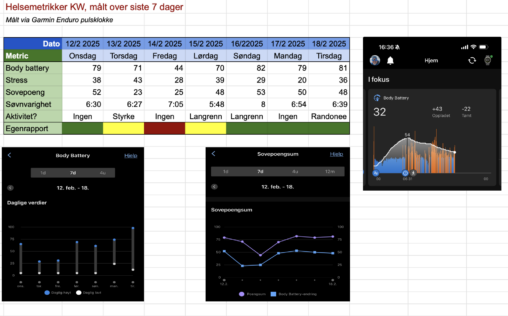
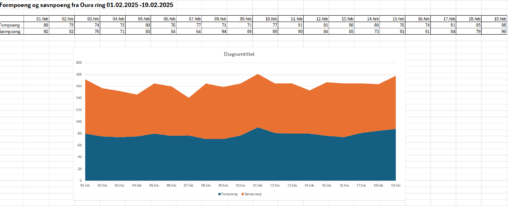
Denn grafen illustrerer ulike helsemetrikker hentet ut fra min Garmin-klokke som følger meg 24/7. Her registreres foruten ulike helsemtrikker min fysiske aktivitet og jeg kan måle hvordan mitt…
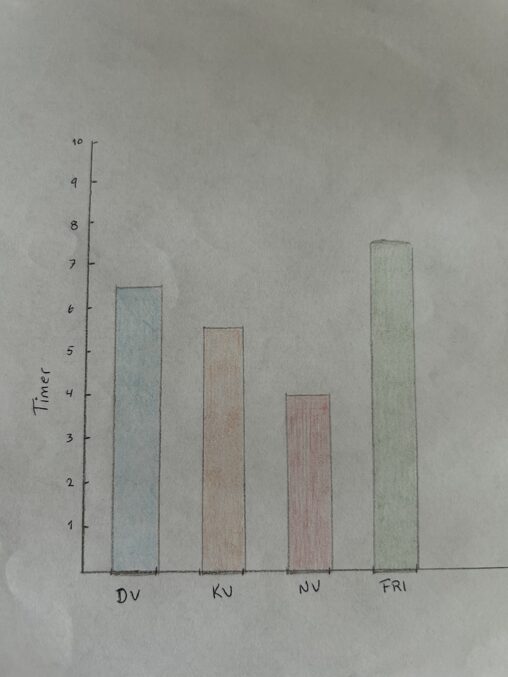
Gjennomsnitt timer søvn fra siste måneden, data hentet fra klokke. Jeg jobber tredelt turnus, dagvakter, kveldsvakter og nattevakter. Dette viser hvor mange timer jeg i gjennomsnitt sover etter…
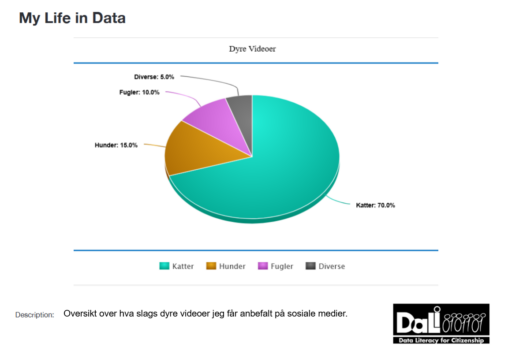
A simple look into the types of animal videoes I get recommended on social media.
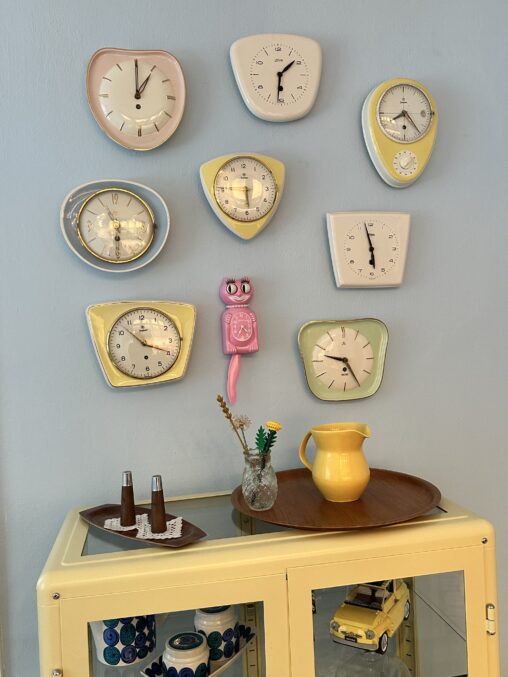
This is my kitchen clock wall, where I have collected different retro clocks (they are not wound). Each clock is set to match an individual family member’s time…
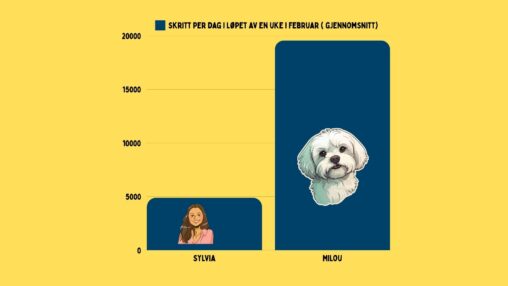
Grafen viser gjennomsnittlig hvor mange skritt hunden min og jeg gikk i løpet av en uke i februar, når jeg regnet at hunden min går 4 steg for…