2107 Data visualizations Categorized "my life in data" (page 33 of 106)
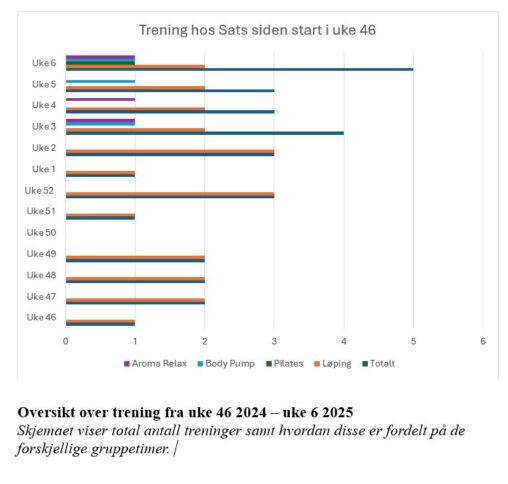
Oversikt over trening hos SATS for å sammenligne hva jeg har gjort mest av siden jeg startet. Oversikten viser også hvor mange ganger jeg har trent per uke.
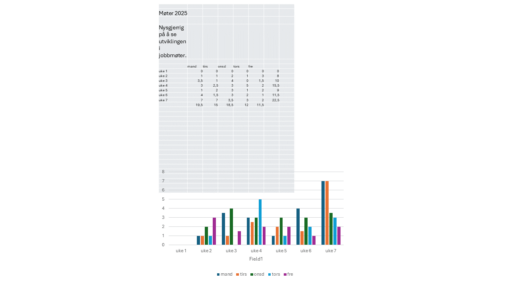
Dataene i tabellen viser antall timer hver dag i en uke som er brukt på møter i arbeidstiden. Deretter er tabellen gjort om til et stolpediagram. Ønsket var…
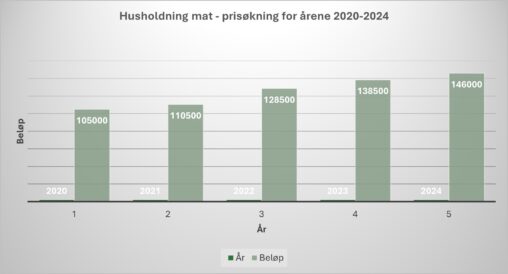
Stolpediagram som viser innkjøp av mat til familie på to og som samtidig til dels viser prisøkningen som har vært på matvarer i årene fra 2020 til 2024….
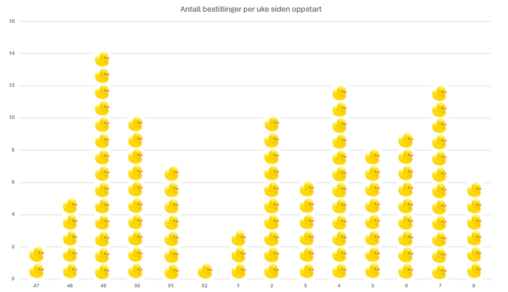
Ny jobb, nye muligheter. Hvor mange bestillinger er gjort på prosjektene mine per uke siden oppstart? Hvorfor må stolpediagrammer være stolper med farger? Why not ducks?
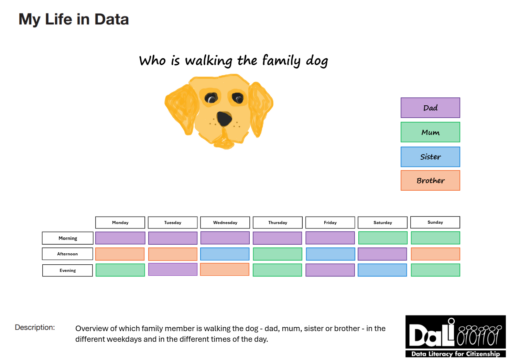
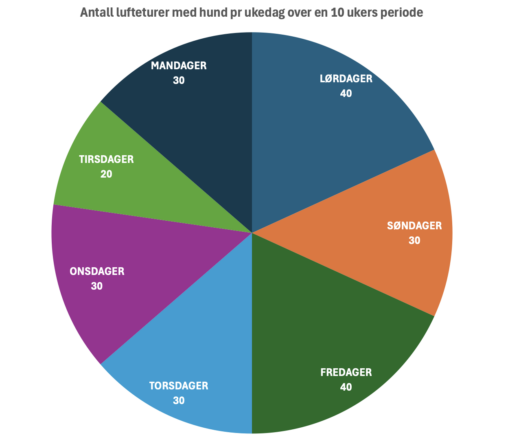
Table overview over who is walking the dog (dad, mum, son or daughter) the different weekdays and different times of the day (morning, afternoon, evening). The table shows…
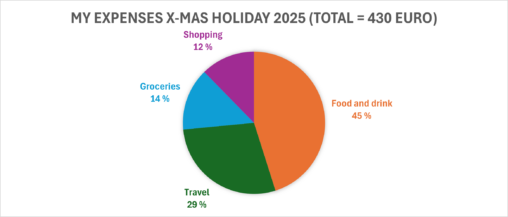
Expenses in euro’s during Christmas holiday divided in main categories. Personal expenses from bank account. No copyright and anonymised. Made in excel.
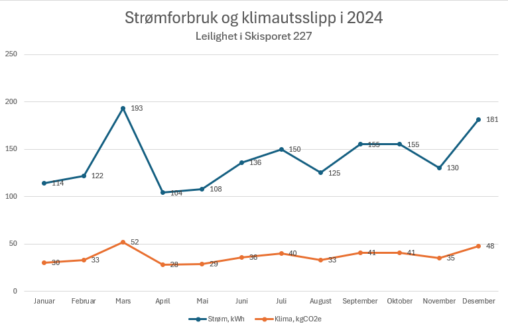
Figuren viser strømforbruk (kWh) og klimautslipp (kgCO2e) per måned i 2024. Denne visualiseringen gjelder en leilighet på 86 m2. Data gjelder selveid leilighet – min egen data. Data…
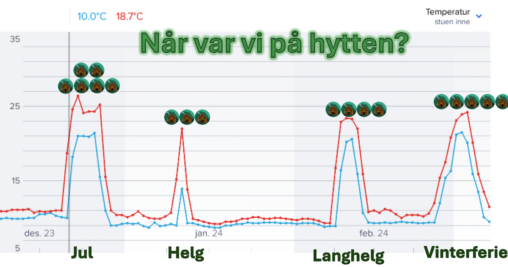
En visualisering av data (når var vi på hytten/antall dager) kombinert med statistikk-data fra temperaturføler i hytten (i bakgrunnen), (Netatmo værstasjon). Hytten har frostsikring og holder rundt 10…
Oversikt antall eposter sendt ut i forbindelse med bryllupsplanlegging uke 4 – 7 2025. text=”mengde eposter om bryllup uke 4 – 7 2025″]
Oversikt over antall eposter sendt ut i forbindelse med oppstart av bryllupsplanlegging uke 4 – 7 2025.
Antall eposter sendt ut de første ukene av planlegging av bryllup uke 4 – 7 2025
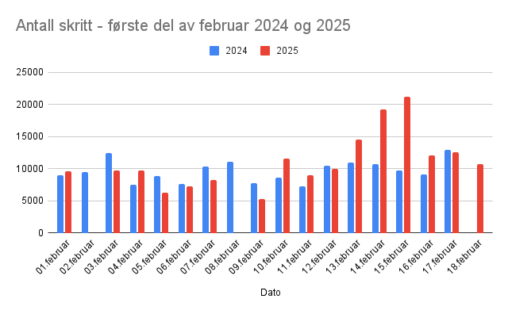
Skrittene er registrert på en Samsung Watch og dataene er hentet fra Samsung Health. De dagene med 0 skritt er dager der jeg ikke har gått med klokken.
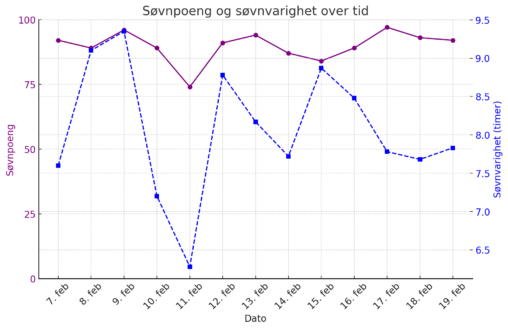
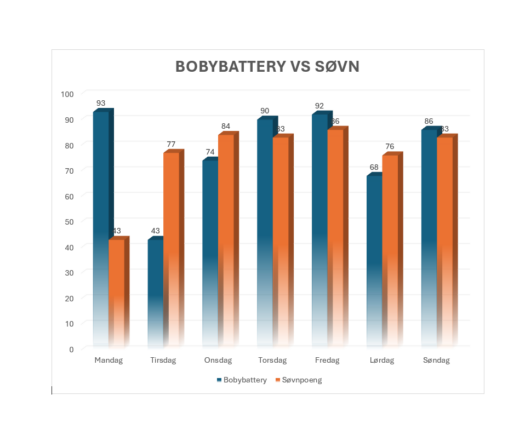
Linjegrafen visualiserer søvnmønsteret over en tidsbegrenset periode. Grafen viser søvnkvalitet målt i poeng (0–100), hvor 0 indikerer dårlig søvnkvalitet og 100 indikerer optimal søvn. Samtidig viser grafen søvnvarighet…
Antall eposter sendt ut i forbindelse med planlegging av bryllup, de første fire uker (uke 4 – 7 2025)