
2107 Data visualizations Categorized "my life in data" (page 32 of 106)
Underveis i emnet er det flere obligatoriske oppgaver som må gjennomføres for å få bestått emnet DIGI610. Eksamensoppgave modul 2 er en obligatorisk oppgave som krever at du…
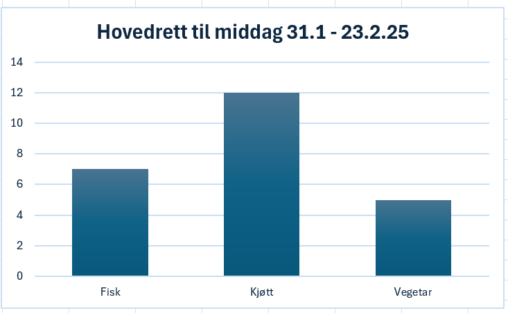
Jeg har notert hva jeg har spist som hovedrett til middag i tre uker, fordi jeg ønsket å se hvor ofte jeg spiser fisk og vegetar. copyright Kari…

Vekt og dato for januar og februar med en prognose for to måneder frem i tid. Kilde: Vektklubben-app Analyse og visualisering: Open AI ChatGPT 4o-februar 2025
Data i oversikten er hentet fra min treningsapp på SPREK treningssenter. Figuren viser en oversikt over type trening jeg har gjennomført på treningssenter de siste 4 månedene.
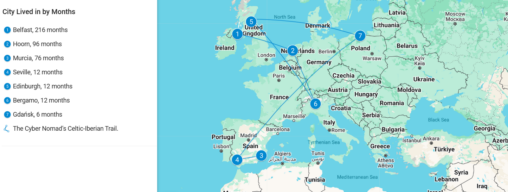
My life’s trail: 216 months in Belfast, 96 in Hoorn, 12 in Edinburgh, 12 in Bergamo, 6 in Gdansk, 12 in Sevilla, 78 in Murcia. #RICT2425
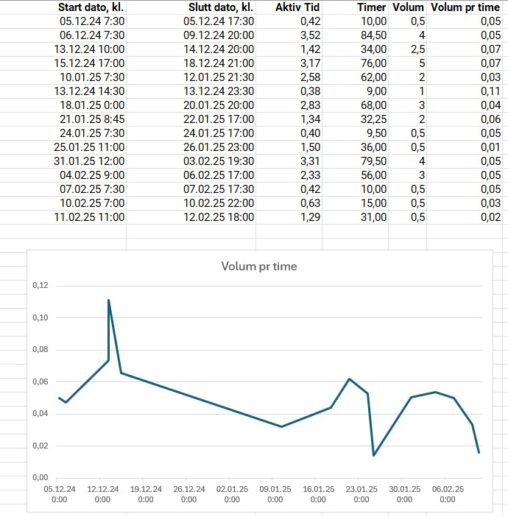
Graf som viser vannproduksjon i avfukter pr. aktiv produskjonstime for angitte avlesingsdatoer
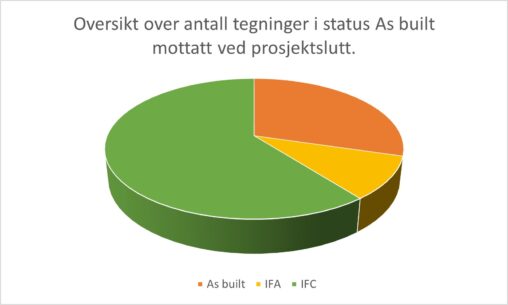
Oversikt over antall tegninger i status As built mottatt ved prosjektslutt.
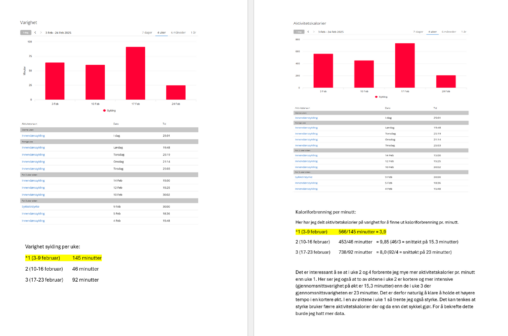
Oversikt over mine oppvarmingsøkter på innendørssykkel over de siste tre ukene. Jeg har sett på varighet, hyppighet og aktivitetskalorier og funnet ut hvor mange aktivitetskalorier jeg forbrenner pr….
Oversikt over antall minutter syklet pr. uke over 3 uker, har så funnet frem data over antall aktivitetskalorier brukt samlet pr. uke over de samme tre ukene. Har…
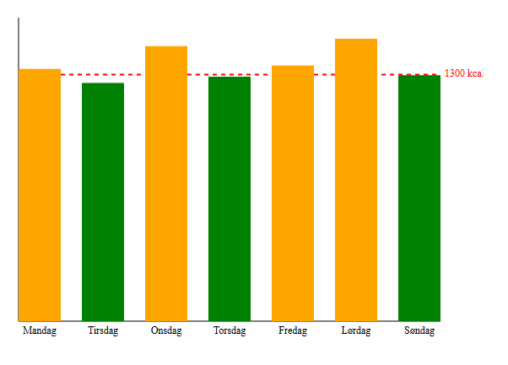
Søylediagrammet viser data over en ukes kaloriinntak. Diagrammet viser anbefalt kaloriinntak pr dag er 1300 kcal. Diagrammet gir oversikt over samlet kaloriinntak pr dag, samtidig som det gir…
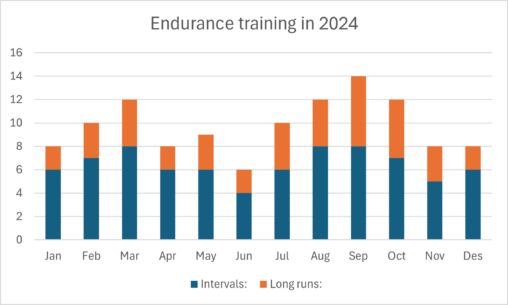
The graph visualizes my personal running journey in the year 2024. It displays the amount and types of runs I went on throughout the year. The blue part…
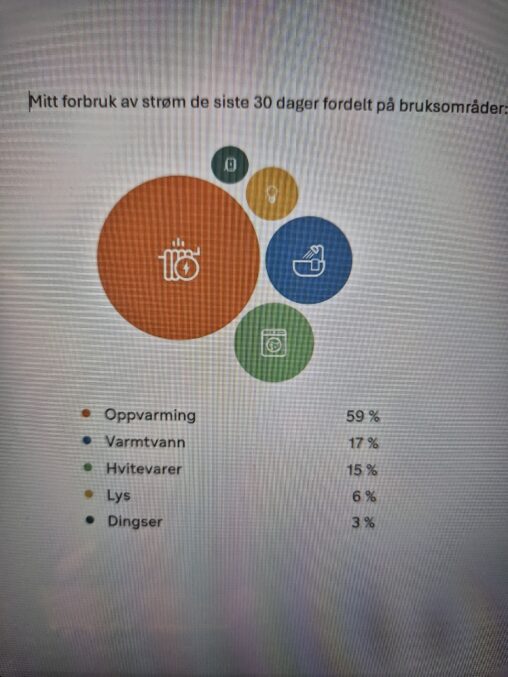
Her er det fremstilt strømforbruk i husholdningen fordelt på bruksområder i løpet av siste 30 dager. Figuren viser at største strømforbruket går til oppvarming av bolig.
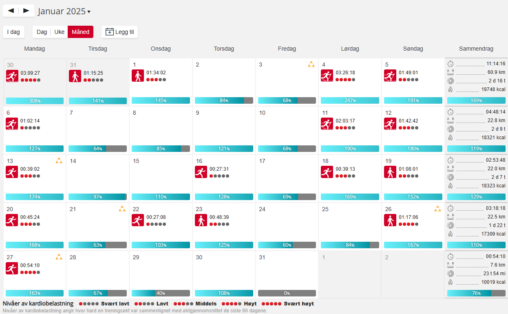
Dataene viser registrerte treningsøkter, treningsform, treningstid og intensitet.
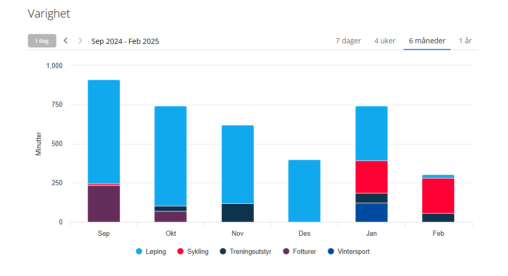
Visualisation of my training activities for the last 6 months. The activities are categorized into type of activity. Showing minutes trained per month.
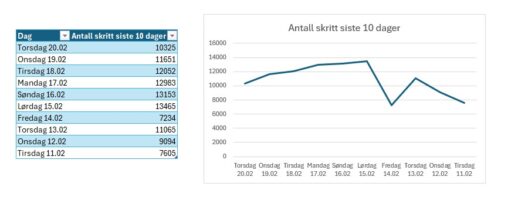
Dataen viser en oversikt over antall skritt jeg har hatt over 10 dager i perioden 11.02.25 – 20.02.25
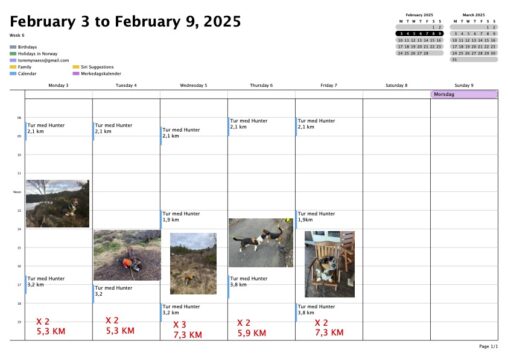
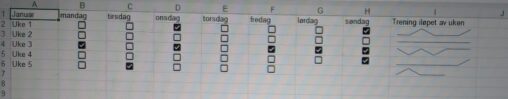
A weekly calendar where I have put down my walks with my dog. Here you find the time of day, the length of the walks, and how many…
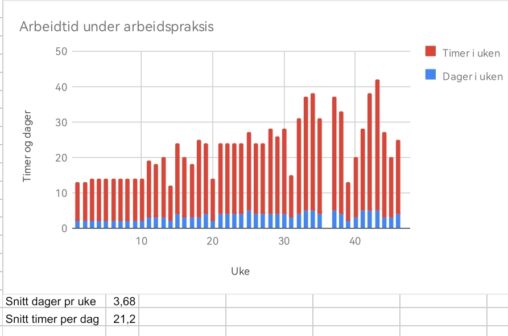
Antall timer i arbeidspraksis i regi av NAV, creative common licence, anonym