
2107 Data visualizations Categorized "my life in data" (page 30 of 106)
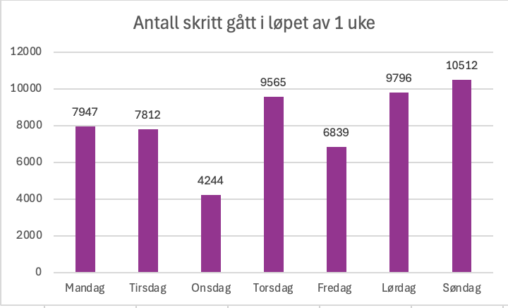
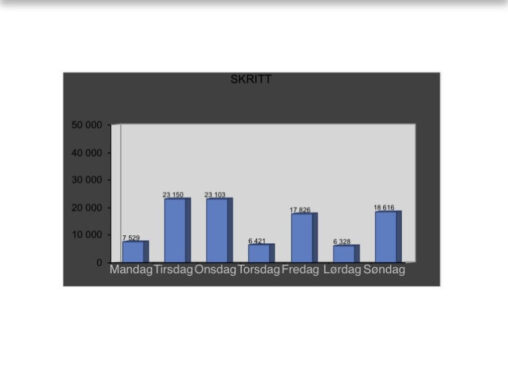
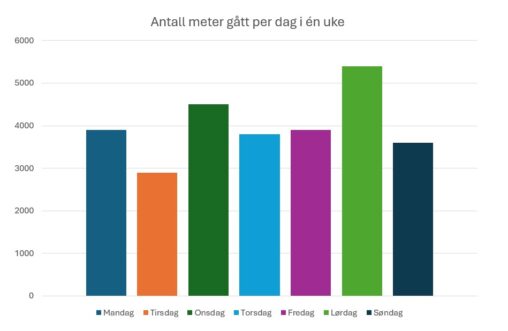
Datavisualiseringen viser hvor mange skritt jeg gikk i løpet av en uke, målt i antall skritt per dag. Dataene er målt med apple Watch.
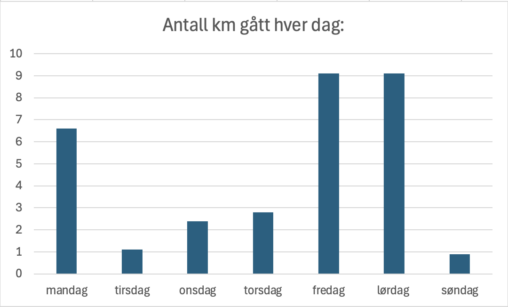
Dette er antall skritt jeg har gått hver dag i en uke, målt i kilometer. Dataen er hentet fra min iPhone, så det vil være noe som mangler…

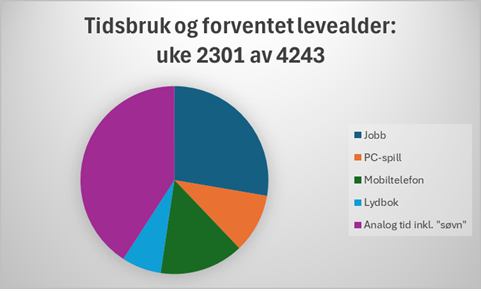
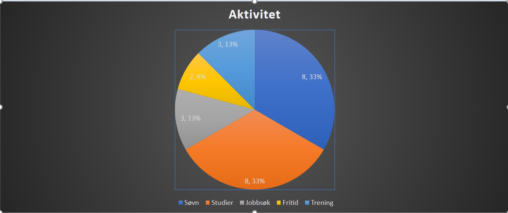
Kakediagram som viser omtrentlig tidsbruk i uke 2301 av en gjennomsnittlig forventet levealder på rundt 4243 uker. Kategorien “Jobb” hentet fra timeliste, “Lydbok” fra gjennomsnitt fra siste måned…

A visualization of the countries where I, previously and current, have worked in.
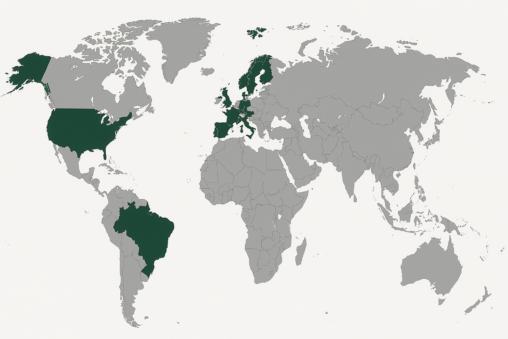
A map of the world visualizing the countries where I, previously and current, have worked in. No data owner.
Diagrammet viser en strukturert fremstilling av antall skritt gått per dag i løpet av en uke, mandag til søndag, på ferie i London. Dager og skritt er lagt…
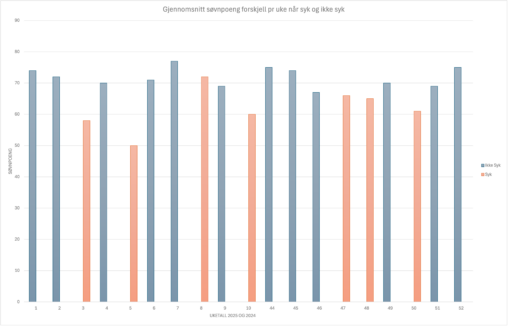
Oversikt over gjennomsnitt søvnpoeng forskjell når syk og ikke syk. Loddrett viser Søvnpoeng skala fra 0-100 og vannrett viser uketall. Blå søyler viser ikke syk og oransje søyler…
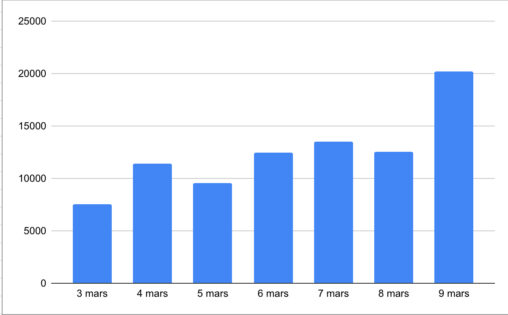
Denne visualiseringen viser antall skritt jeg har gått hver dag i løpet av en uke (fra 03. til 09. mars 2024). Dataene er hentet fra min egen mobiltelefon…
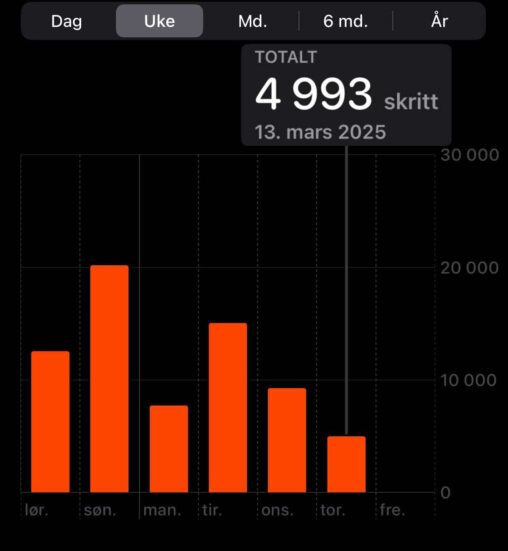
Denne visualiseringen viser antall skritt jeg har gått hver dag i løpet av en uke (fra 10. til 13. mars 2024). Dataene er hentet fra min egen mobiltelefon…
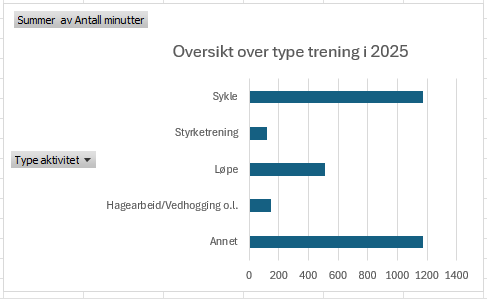
Jeg har benyttet søylediagram over en periode. Data er tatt ut i fra min side hos Aktiv Trening.
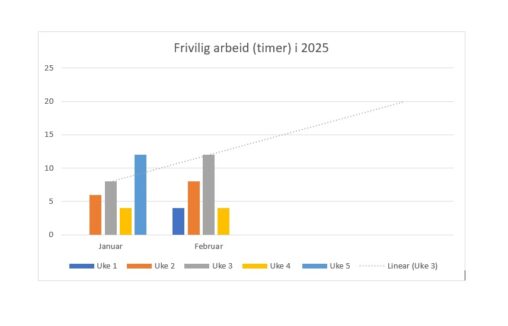
Har laget et oversikt over antall timer jeg brukte på frivilig arbeid, til dagen dato i 2025
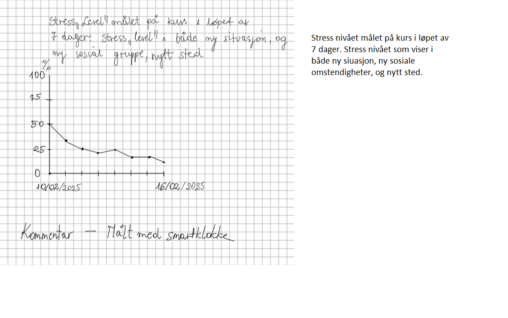
stress nivået målet på kurs i løpet av 7 dager. Stress nivået i ny situasjon, ny sosiale miljø, og nytt sted. jeg eier data
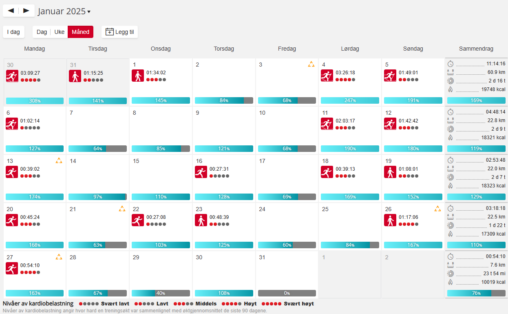
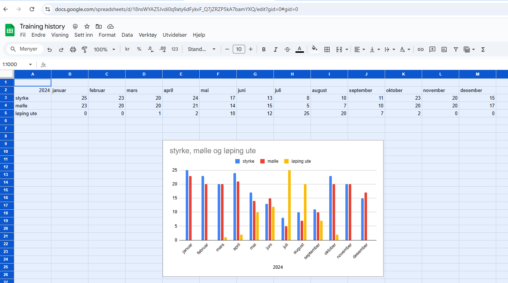
Data fra treningsklokke overført til skylagring. Viser mengde trening, treningsform, tid og dato