
2089 Data visualizations Categorized "my life in data" (page 27 of 105)
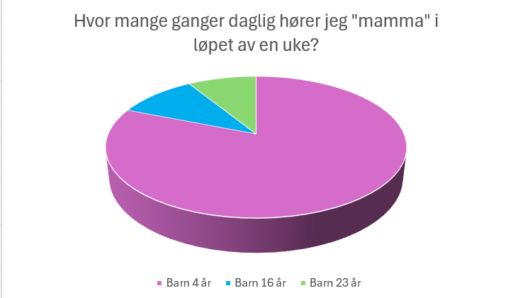
Dette kakediagrammet viser hvor stor andel av “mamma-ropene” som kommer fra hvert av mine tre barn i løpet av en gjennomsnittsdag. Jeg har telt i en uke, og…
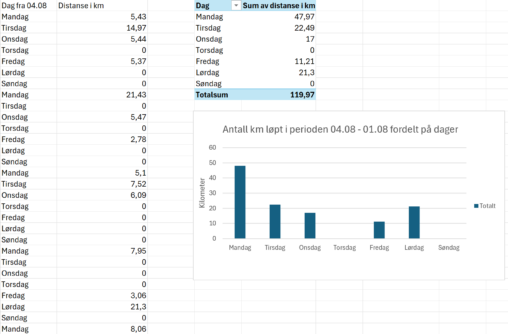
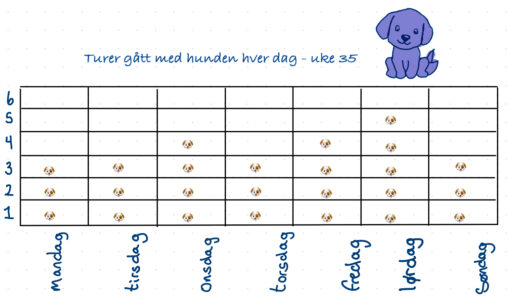
Samlet antall kilometer som er løpt i en gitt periode (04.08.2025 – 01.09.2025) og fordelt dem på de respektive dagene de er løpt for å visualisere hvilke dager…
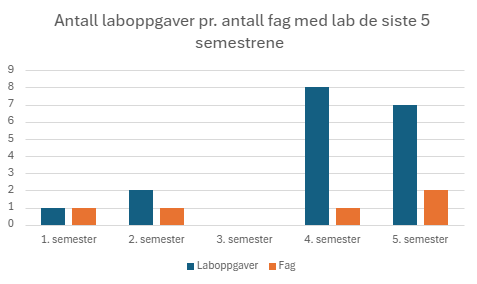
Et søylediagram med 2 søyler som representer 1, antall laboppgaver og 2, antall fag med lab i løpet av min studietid. X-aksen representerer semestre og y-akse antall. Enhetene…
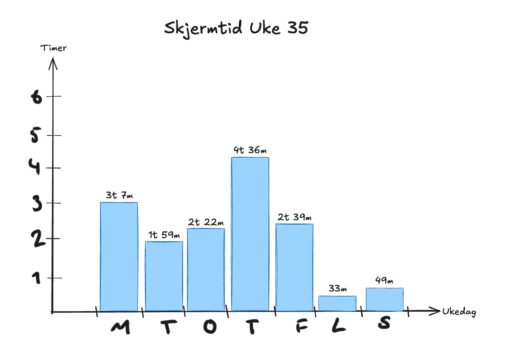
Week 35 iPhone screen-time, represented with a column for each day of the week, with the time being represented in a “hour minute” format.
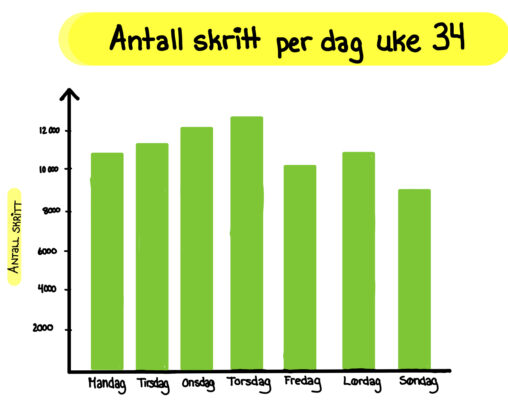
Dette er et stolpediagram som viser antall skritt per dag i løpet av én uke, med verdier på Y-aksen angitt i antall skritt og dager på X-aksen fra…
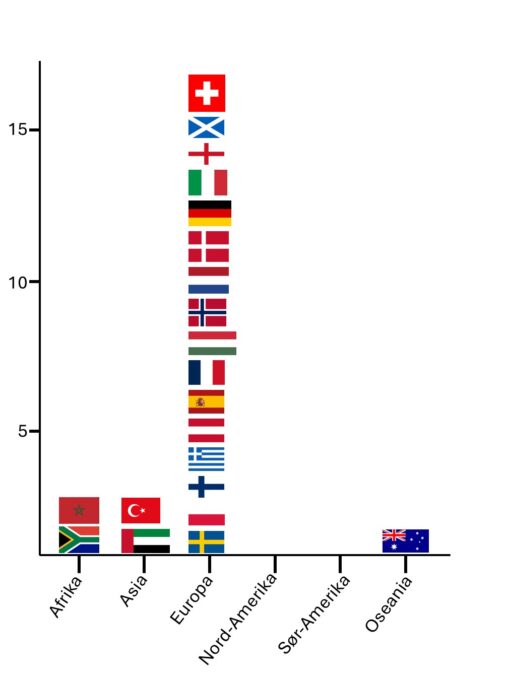
Land jeg har besøk i løpet av livet mitt, sortert etter verdensdel. Landene er representert ved flagget sitt. Antall land på y-aksen. Dataene tilhører meg selv. Bilder av…
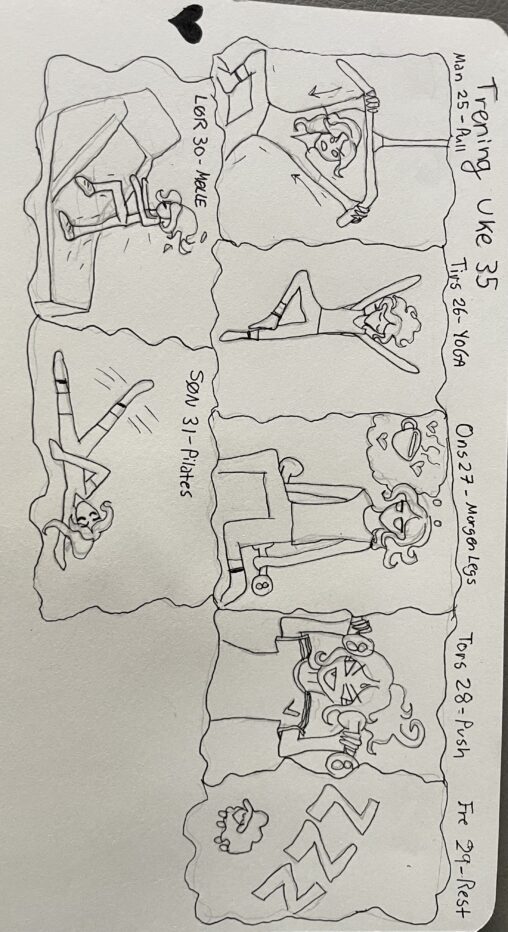
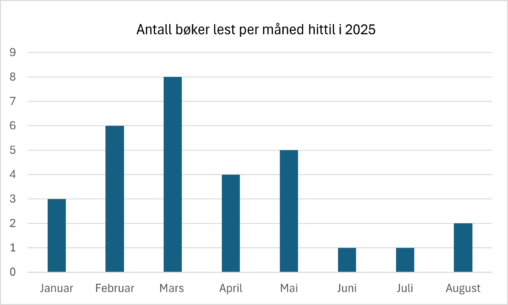
Diagram av antall bøker lest i månedene januar til august. Data hentet fra goodreads som jeg har registrert selv. Dataene er ført over i en tabell i excel…
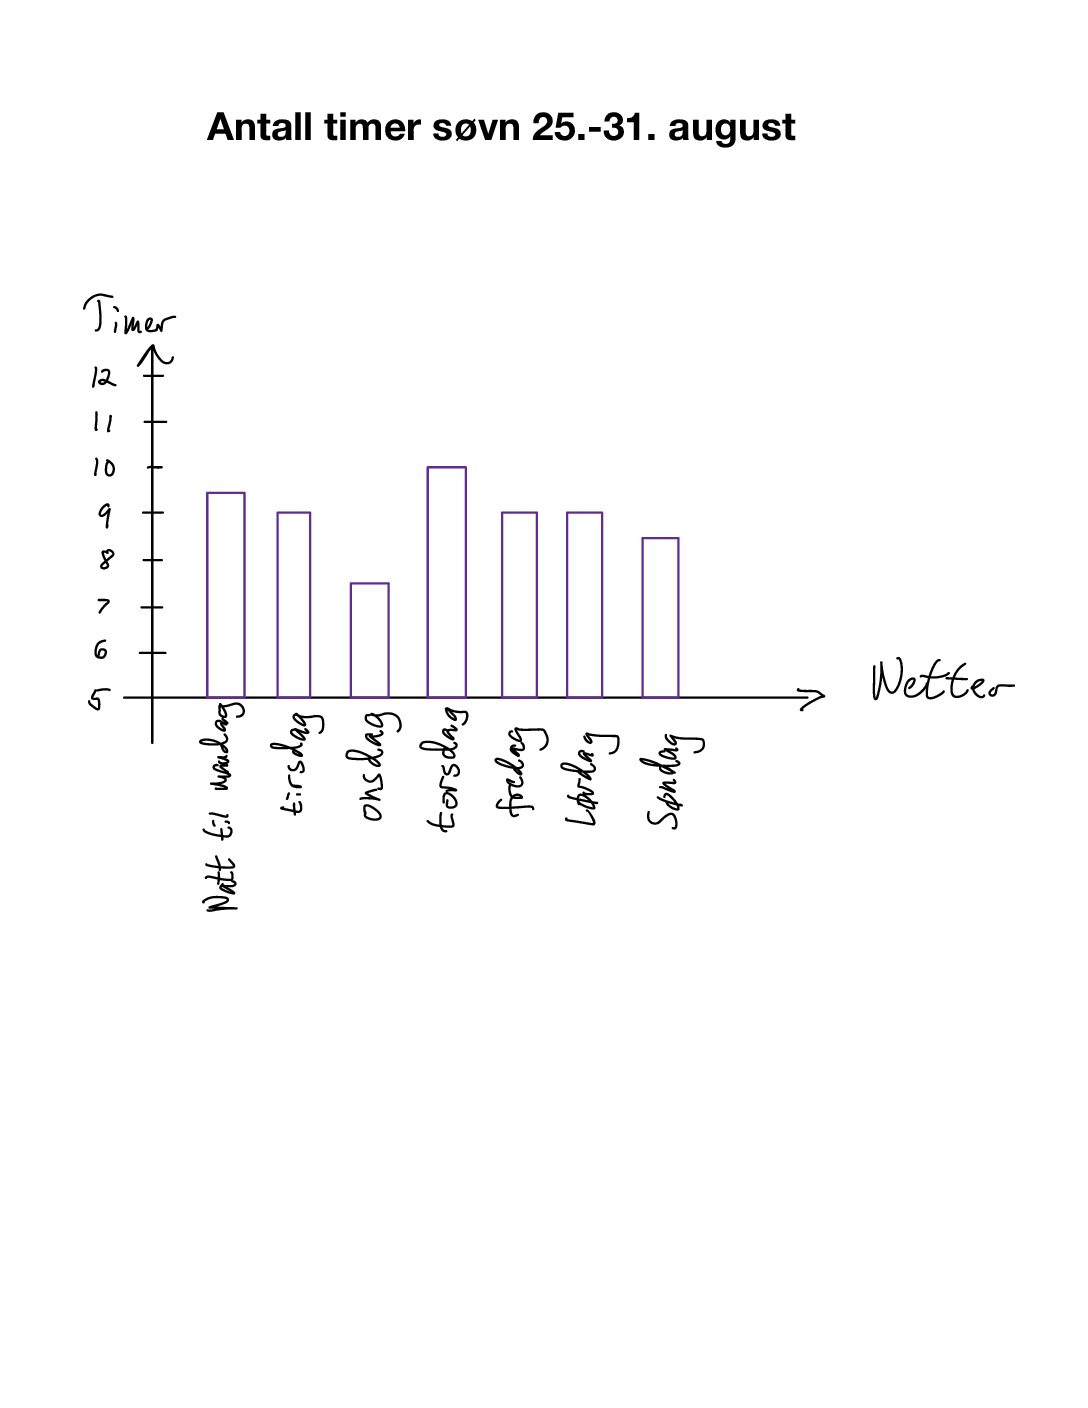
Dette er en visualisering i form av et søylediagram som representerer søvnen min mellom 25. august og 31. august. Jeg valgte dette pga. jeg prøver å få nok…
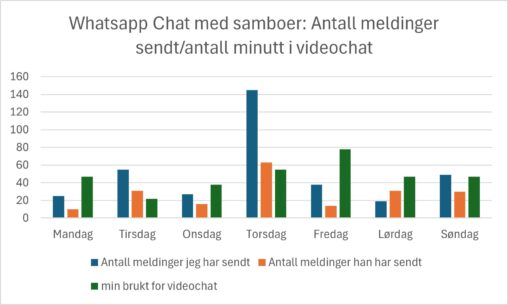
Antall meldinger sendt og fått i whatsapp chat med samboeren min i løpet av en uke. I tillegg antall minutter vi videochattet hver dag. Bilder, kun emojis sendt…
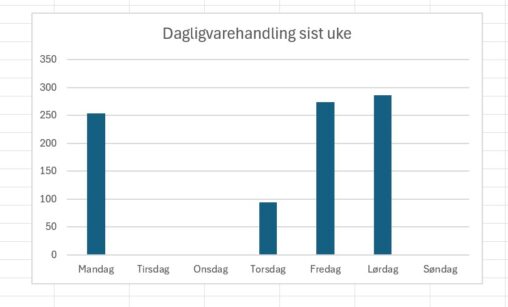
Visualisering av denne ukas kjøp av dagligvarer. Viser dagene i uken, og sum penger (i kroner) som ble brukt på dagligvarer den aktuelle dagen.
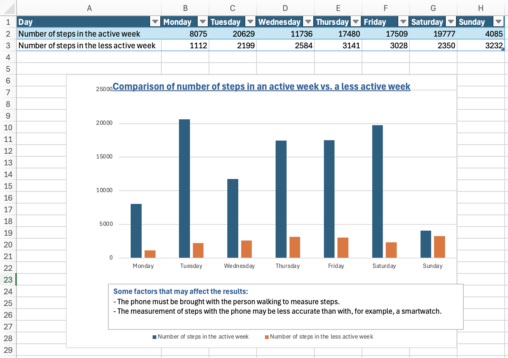
In this diagram I have presented the amount of steps taken in an active week, compared to a less active week. I have collected information from the health-app…
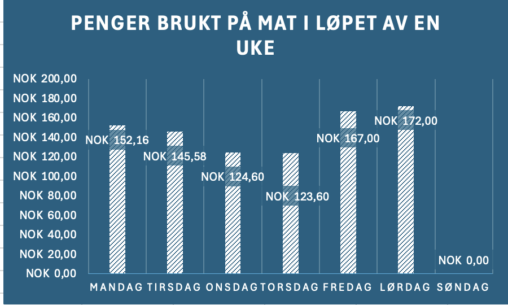
Her har jeg lagt inn mitt ukentlige forbruk på mat som student i en vanlig uke.
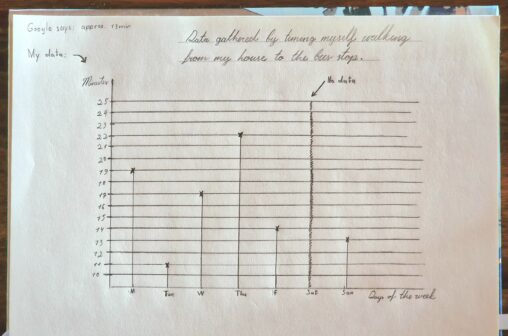
This is a visualization of the data I gathered by timing myself walking from my home to my bus stop and comparing it to the approximate time that…
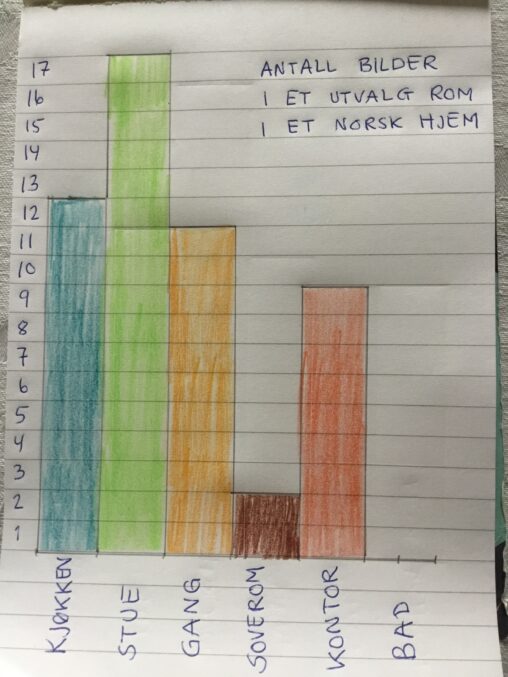
Her har jeg talt antall bilder på veggene, fordelt på rom, og laget et håndtegnet søylediagram.
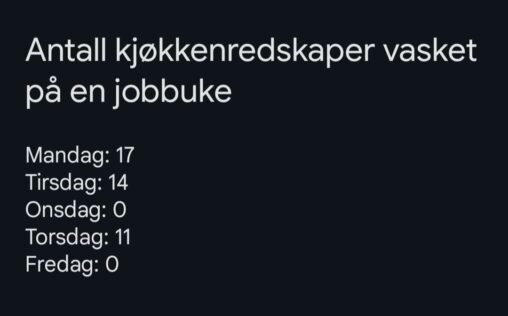
Med kjøkkenredskaper menes det f.eks. tallerken, bestikk, kjeler, ostehøvel, kopper, osv. Jeg har ikke oppvaskmaskin så alt vaskes for hånd. Dersom det ikke er mye å vaske, f.eks….
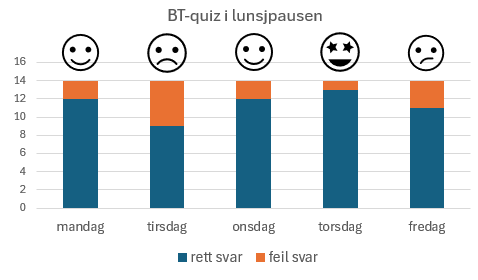
Antall rette svar i BT-quizen Hvor mange rette svar på 14 spørsmål fikk vi i lunsjpausen i løpet av en uke. Vi er i snitt 7 kollegaer i…