
2092 Data visualizations Categorized "my life in data" (page 2 of 105)
Visualization of transport method used based on the activity detection feature in Google Maps Timeline. Distance is in km and time is in minutes.
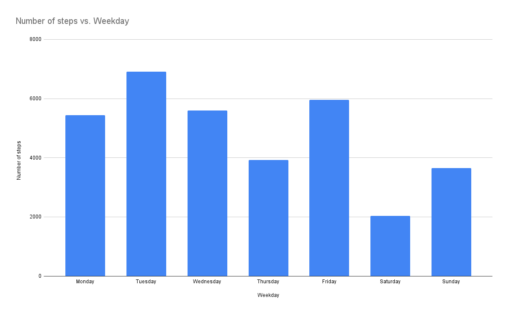
The bar chart visualises the number of steps I took that my digital watch recorded in week 8. The number of steps have been divided into weekdays to…
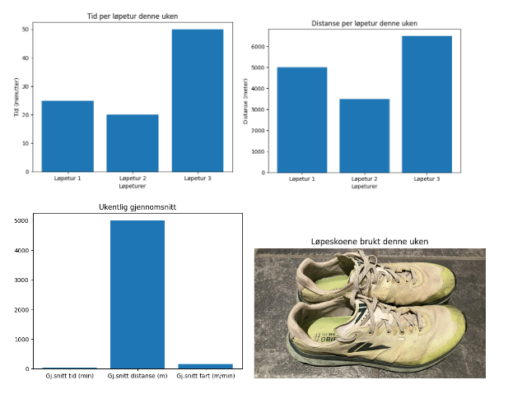
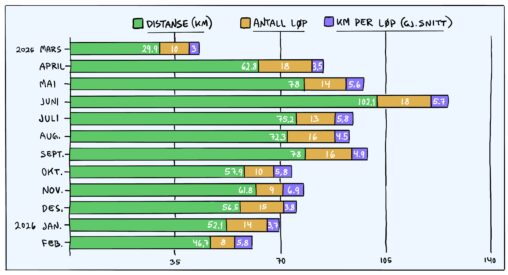
I denne datavisualiseringen, har jeg, ved hjelp av ChatGPT til å lage grafer for mine data, visualisert de tilgjengelige data for mine løpeturer denne uken. Dette inkluderer hvor…
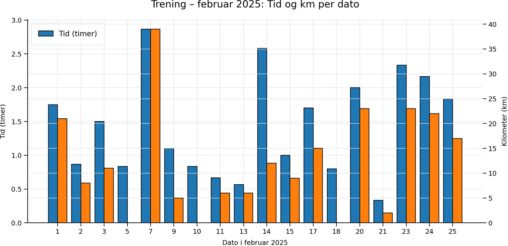
Jeg har registrert trening for dagene i februar og talt antall km og tid de dager jeg har trent. Dette er satt opp i en tabell og senere…
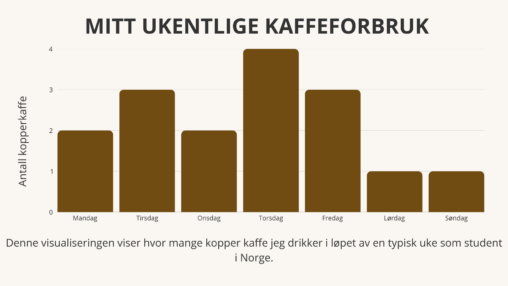
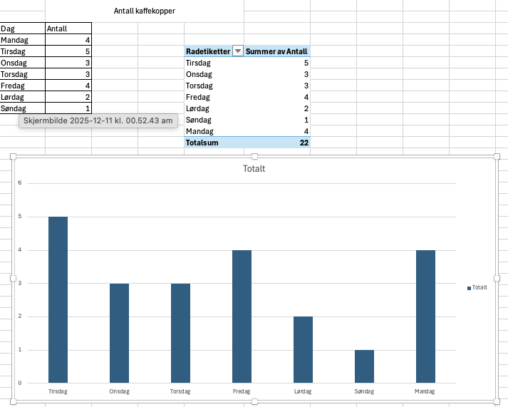
Denne visualiseringen viser antall kopper kaffe jeg drikker per dag i løpet av en typisk uke som student i Norge. Dataene er samlet inn manuelt og representerer mitt…
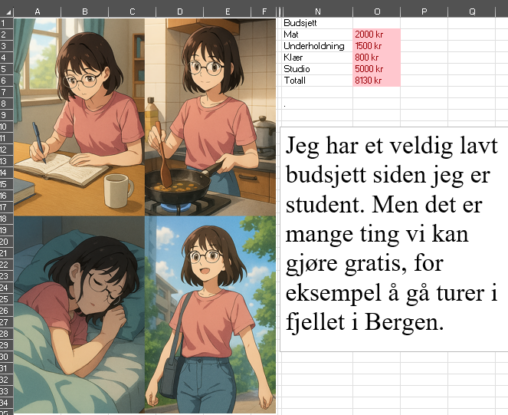
Den korte teksten er inspirert av studentlivet, både det økonomiske og hvordan vi kan være sosiale uten å bruke mye penger. “Jeg har et veldig lavt budsjett siden…
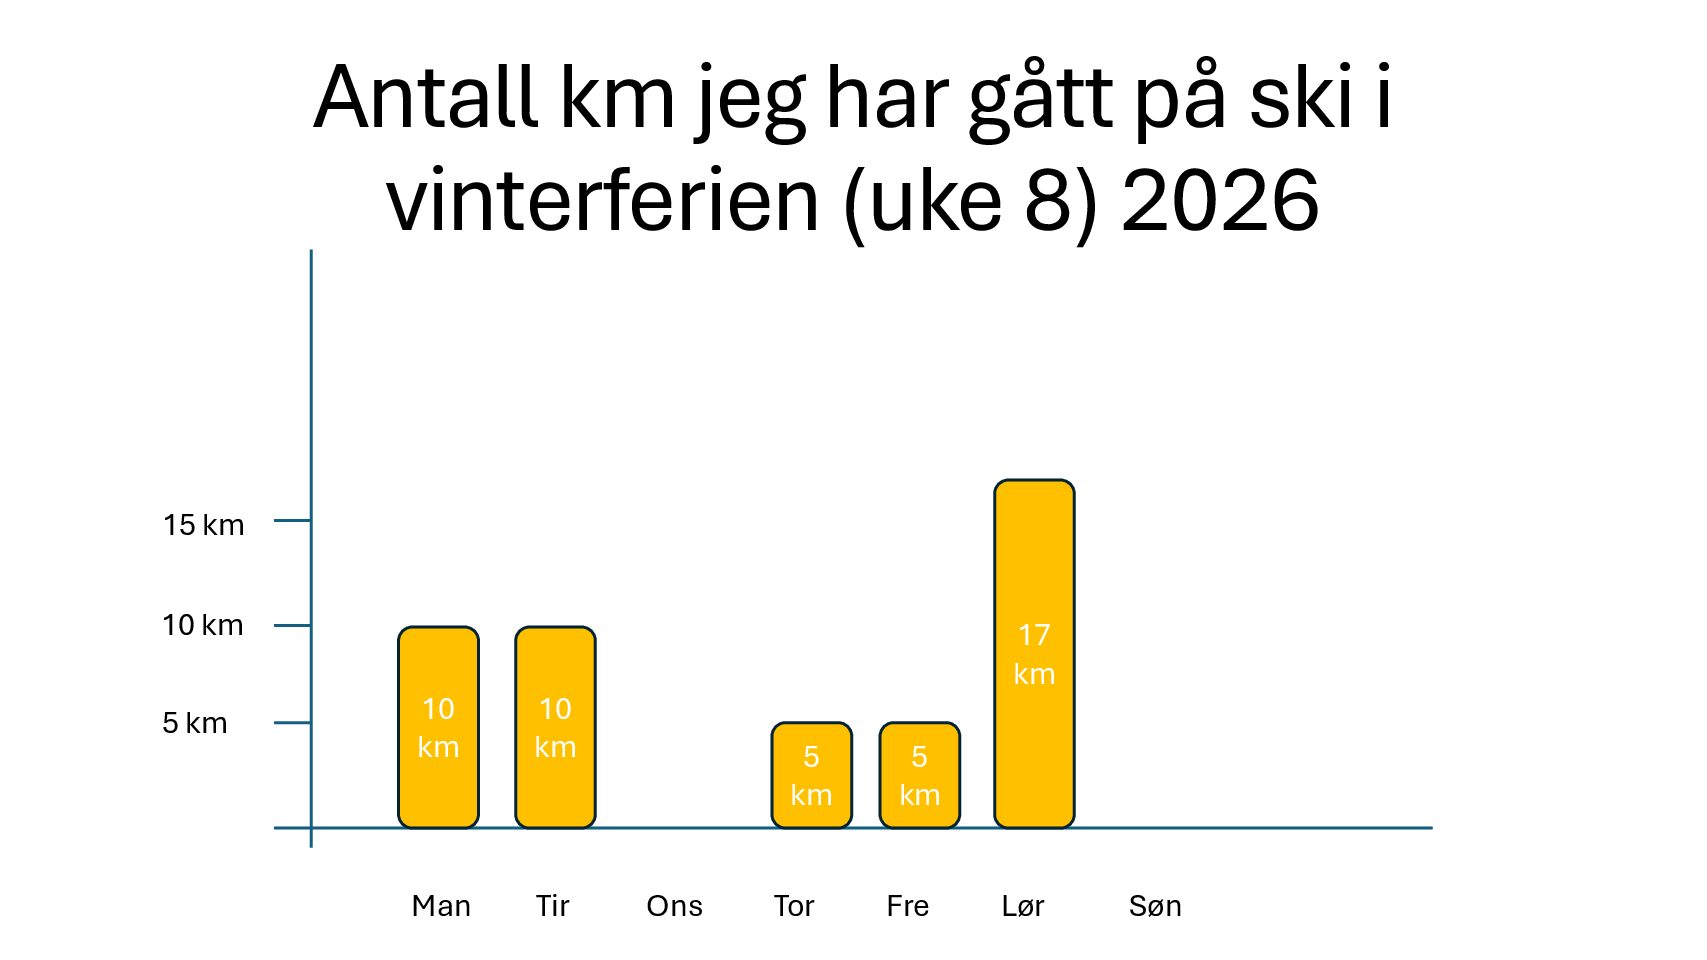
representation of Camilla Brodtkorb’s distance of cross country skiing during week 8 2026. By Camilla Brodtkorb
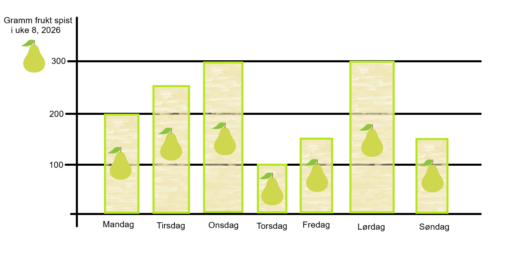
Dette er en visualisering av hvor mange gram frukt jeg har spist i uke 08 i 2026.
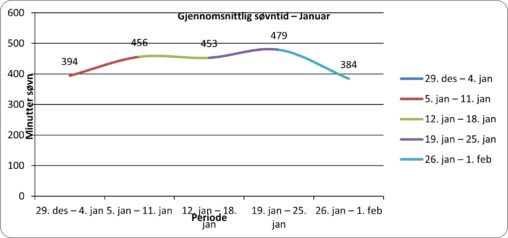
This visualization shows my average sleep duration per week from 29 December to 1 February, measured in hours and minutes. The data is presented as a line chart…
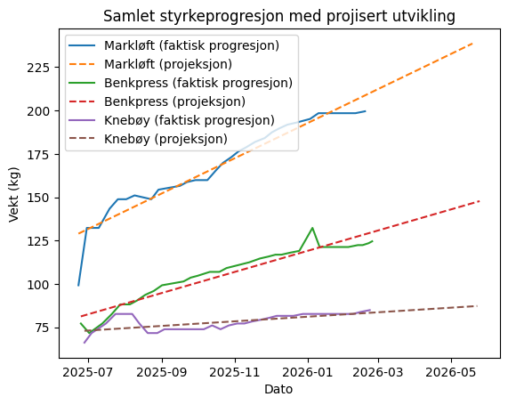
Min progresjon i benkpress, markløft og knebøy fra jeg startet styrketrening for 6 måneder siden.
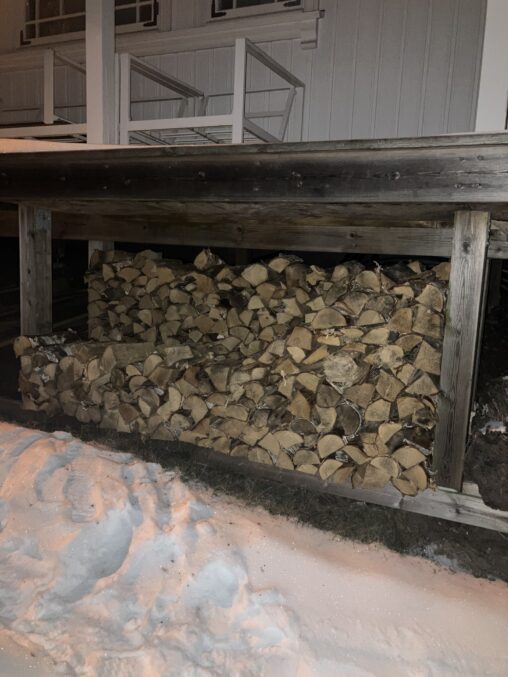
Wood left to heat up our house for the rest of the winter season 2026. Photo taken on February 10, 2026
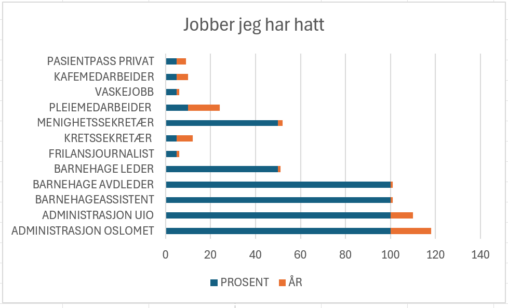
Dette stablede liggende stolpediagrammet viser ulike jobber jeg har hatt, omfang i prosent og lengde på jobbene i antall år.
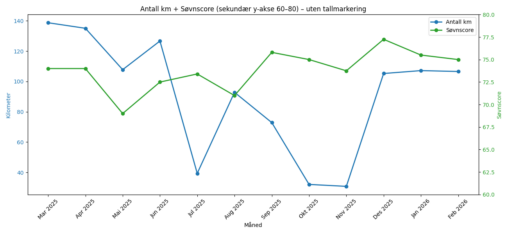
Visualiseringen viser månedlige data for løpte kilometer (km) og søvnscore for perioden mars 2025 til februar 2026. Kilometer er plottet på primær y‑akse, mens søvnscore vises på sekundær…
Grafen viser hvordan løpeturene mine har endret seg gjennom ett år. Vår og sommer i fjor var preget av økende mengde og lengre økter, mens høsten stabiliserte distanse…
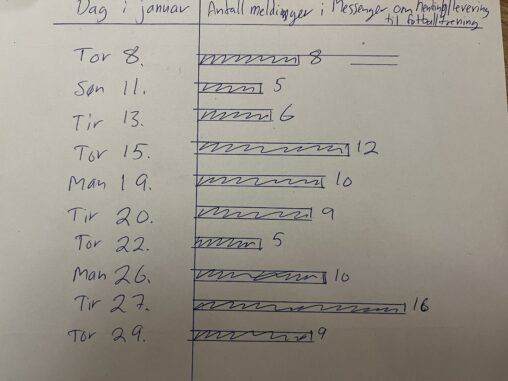
Antall meldinger registrert pr dag i foredregruppe i messenger om kjøring til og fra fotballtrening for barn
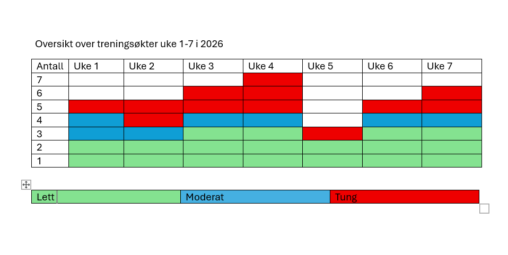
skjemaet viser mine treningsøkter uke 1-7, 2026 og intensiteten av disse. Det er data fra min hverdag som er satt inn i tabellen