
2100 Data visualizations Categorized "my life in data" (page 19 of 105)
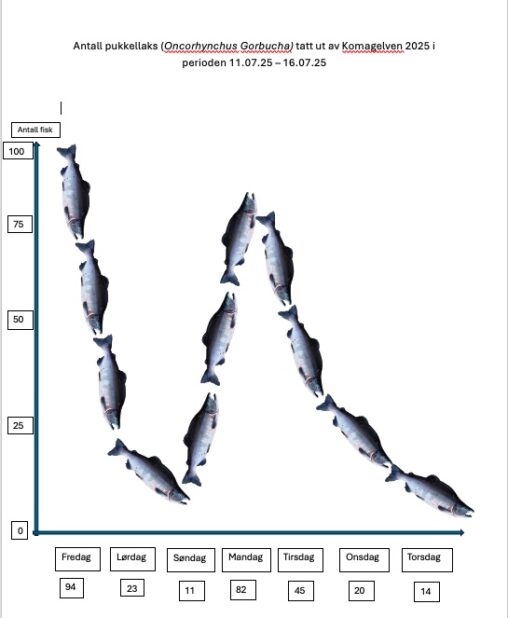
Viser en graf laget av pukkellakser som svømmer, som representerer fangsttall for en gitt periode i Komagelven. Y-aksen er antall pukkellaks, og X-aksen er dagen de ble fanget….
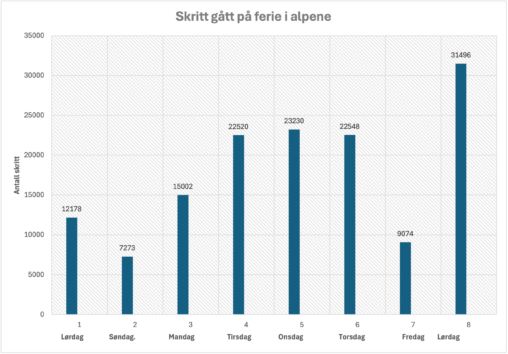
Antall steg gått på ferie i alpene visualisert ved bruk av tall tatt fra Helse appen og diagram laget i Excel
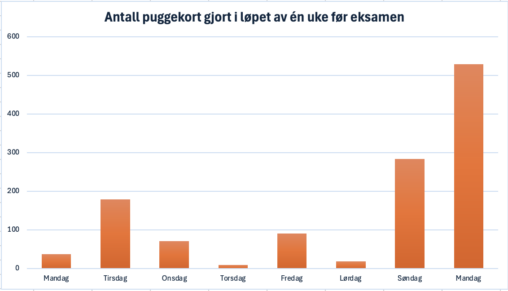
Antall puggekort gjort i løpet av én uke fra mandag til mandag. Y-akse viser antall kort og x-akse viser dagene.
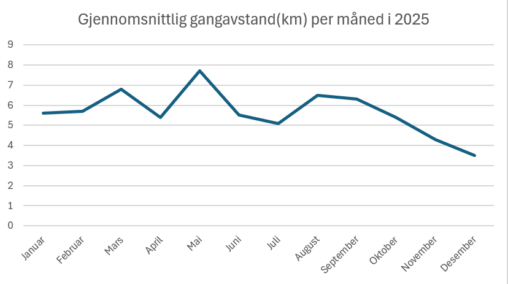
En graf som viser den gjennomsnittlige daglige gangavstanden min per måned i året 2025.
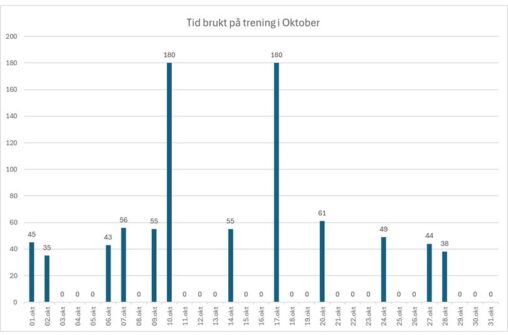
Visualisering av tid brukt på trening i Oktober 2025. Tid er i minutter. Data er kopiert fra appen Hevy, som blir brukt til å logge treningsøkter. Figuren er…

Hvor mange timer med skjermtid jeg hadde på min Iphone hver dag gjennom uke 4 av 2026. Dataene reflekterer hvor mye av mitt liv jeg tilbringer digitalt, og…
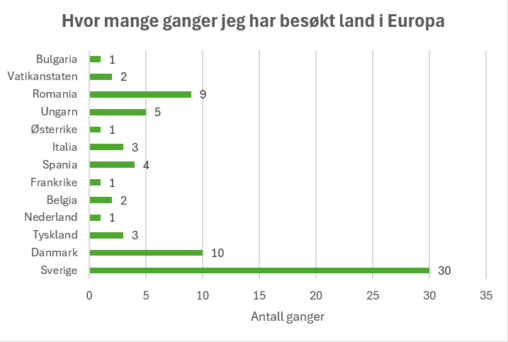
Grafen viser alle land i Europa jeg har besøkt, i tillegg til hvor mange ganger jeg har vært i de, der antall ganger varierer fra 1, opp til…
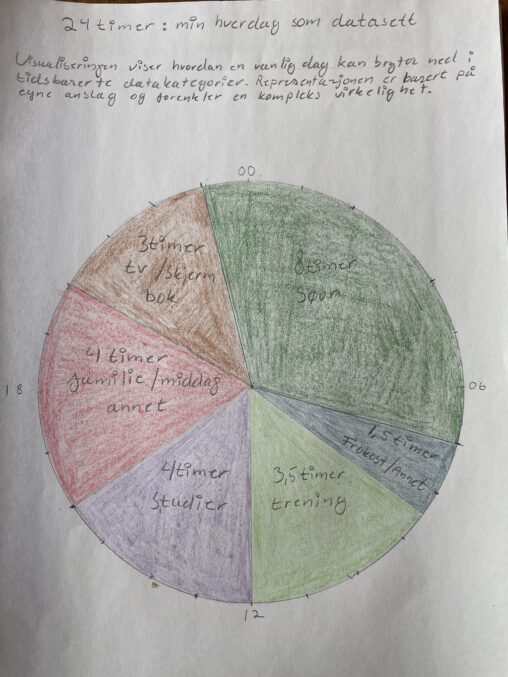
Visualiseringen viser hvordan en vanlig dag kan brytes ned i tidsbaserte datakategorier. Representasjonen er basert på egne anslag og forenkler en kompleks virkelighet. 8 timer søvn, 1,5 timer…
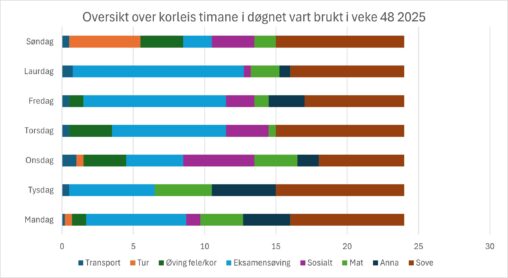
Visualiseringa viser dagane i veka og dei ulike aktivitetane som eg gjorde, samt tal timar som vart brukt på dei ulike aktivitetane.
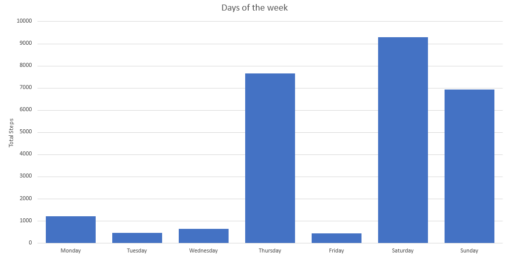
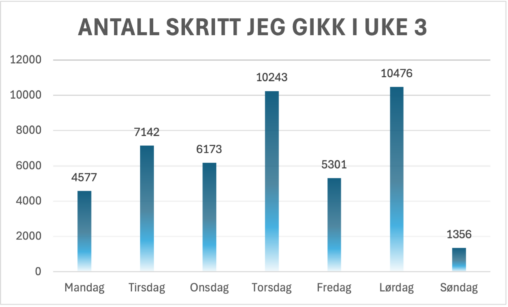
The graph represents the amount of steps walked in the week between December 22nd and December 28th of 2025. The owner of the data represented is myself.
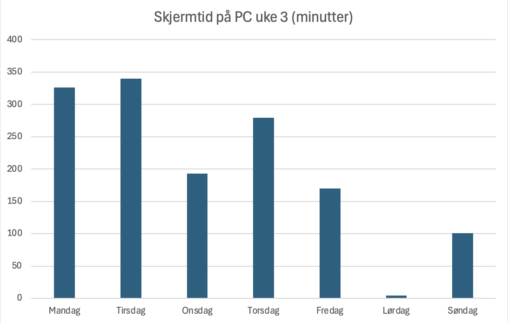
Hvor mange minutter jeg har brukt på PC i løpet av en uke 3, 2026. Dette er funnet gjennom pc-en sin egen innstilling for skjermtid og visualisert via…
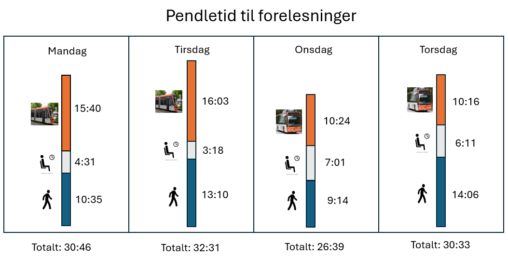
Dataene representerer tiden det tar for meg å pendle hjemmefra til forelesninger på universitetet. Data er målt i minutter og sekunder. Pendling inkluderer spasering, venting på kollektiv transport…
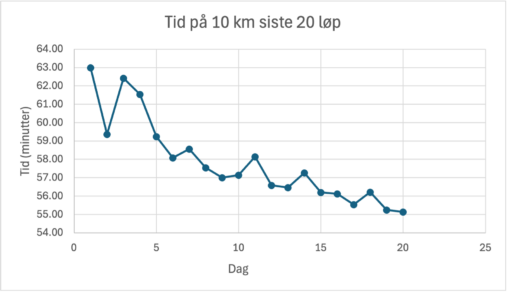
Dette viser en graf laget i Excel fra mine egne data fra 10km løp de siste 20 gangene. Grafen visualiserer hvordan fremgangen går i rykk og napp men…
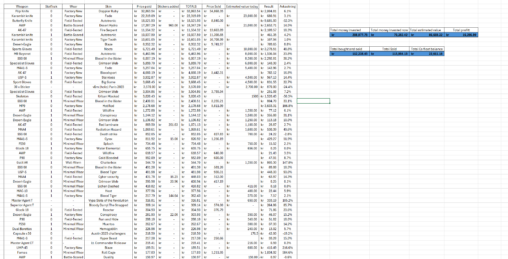
Oversikt over hvor mye jeg har kjøpt ulike skins for og solgt dem for (hvis jeg ikke fremdeles eier de). Har laget kommandoer i excel for å gjøre…
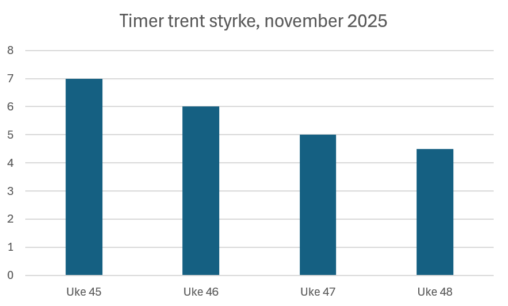
Her er et stolpediagram som viser oversikt over timer trent (ukevis) i november 2025.
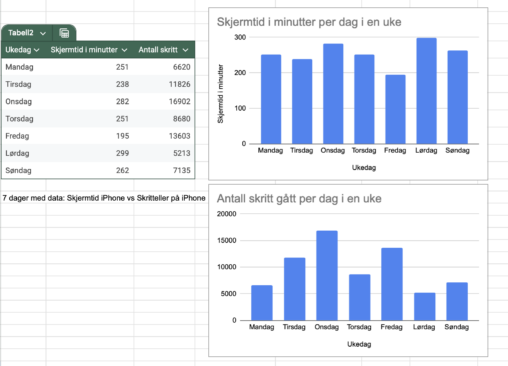
En sammenlikning av noen av de dataene som jeg sjekker oftest på telefonen, nemlig skjermtid og antall skritt gått. Disse dataene vekker sterke følelser, og er definerende for…
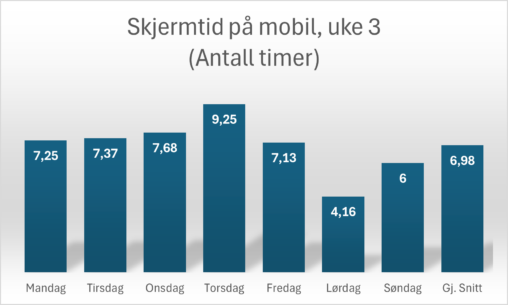
This is a diagram of my screentime on my phone for week 3 of 2026. The numbers of each coloumn is hours of screentime per day. The coloumn…
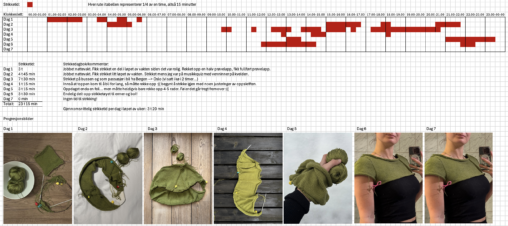
Visualiseringen viser hvilke tidspunkt på døgnet jeg har strikket, og hvor mange timer jeg har strikket i løpet av en dag og totalt i løpet av en uke….