
2107 Data visualizations Categorized "my life in data" (page 11 of 106)
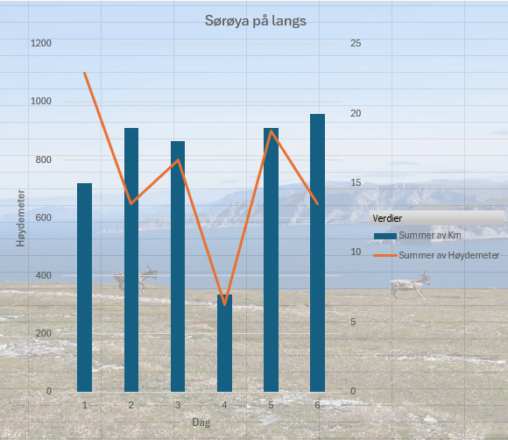
Visualiseringen viser daglige etapper på fotturen “Sørøya på langs” i 6.-11. juli 2025. Den viser distanse i kilometer og samlet høydemeter per dag. Dataene er basert på personlige…
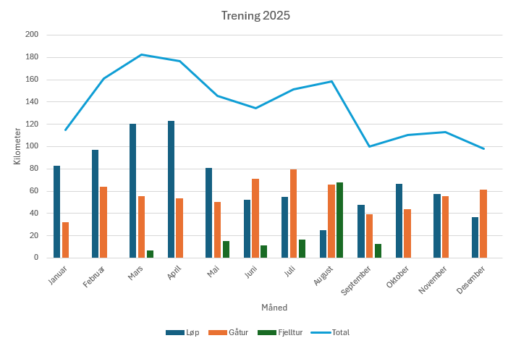
Denne visualiseringen viser mine aktiviteter fra januar til desember 2025. Den viser både løping, gåing og fjellturer i tillegg til den totale antall kilometer utført pr måned.
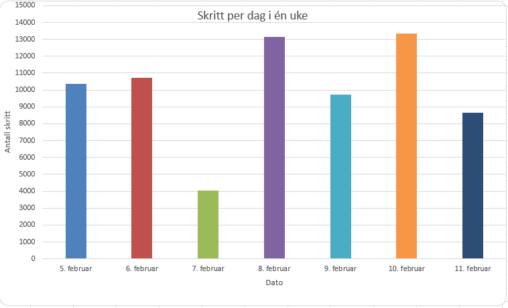
Denne visualiseringen viser en oversikt over antall skritt mål fra torsdag 5.februar til onsdag 11.februar. Dataen er hentet fra min Garmin smartklokke. Grafen viser nøyaktig antall skritt som…
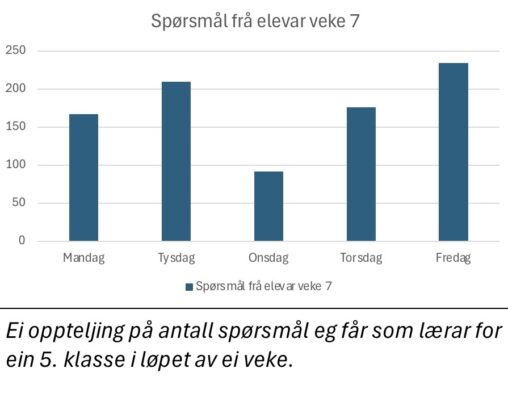
Gjennom veke 7 hadde eg ei registrering på kor mange spørsmål eg fekk av mine elevar i løpet av kvar skuledag.
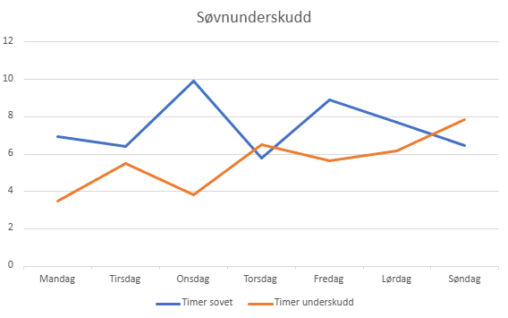
Ringen min sin søvnanalyse, viser at eg har eit søvnbehov på 8t og 30min. Søvnunderskotet mitt blir regulert ut i frå registrert søvn kvar natt.
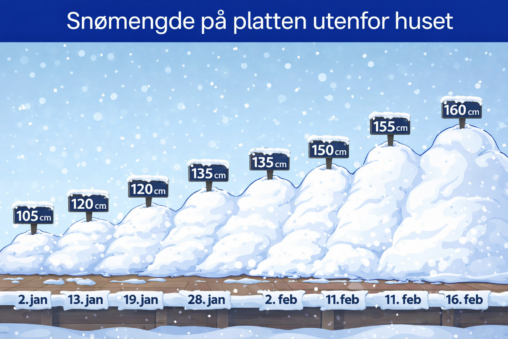
The representation is my own measurements of how much snow is on the terrace outside my house in Tromsoe, Northern Norway, in January and February. The owner of…
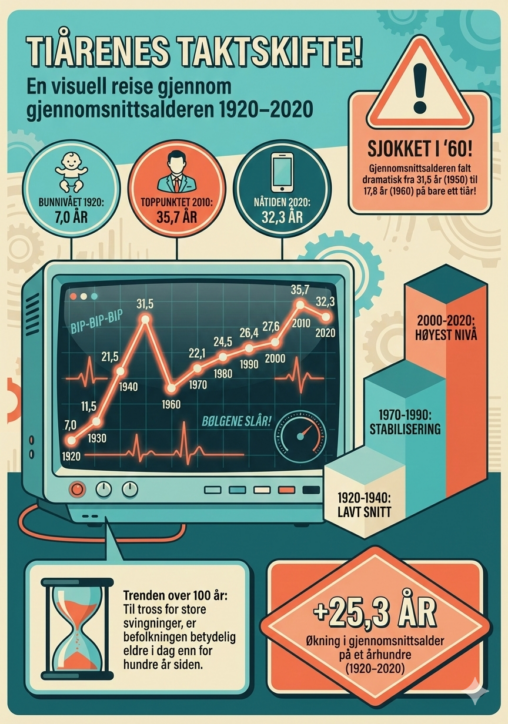
Dataene viser gjennomsnittsalderen på mine nære familiemedlemmer (“befolkningen”) ved inngangen til hvert tiår fra 1920-2020.
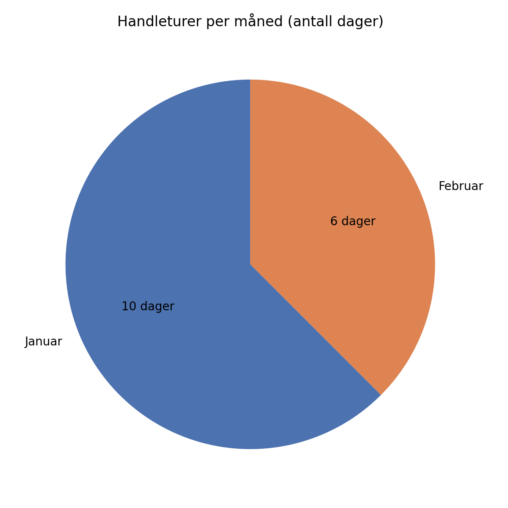
Sirkeldiagrammet ovenfor viser mine handleturer til en dagligvarebutikk så langt i år. Det blå feltet viser at jeg handlet på ti av dagene i januar. Februar er ikke…
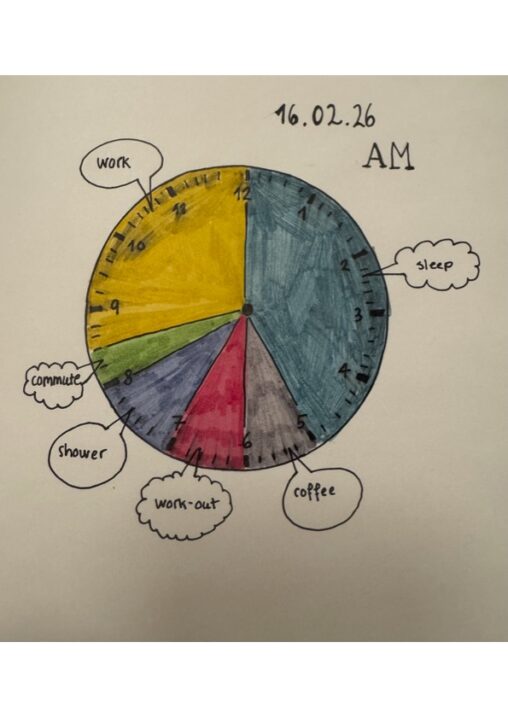
This clock represent how I spent my time on the 16th of February 2026 from 00:00 to 12:00 AM.
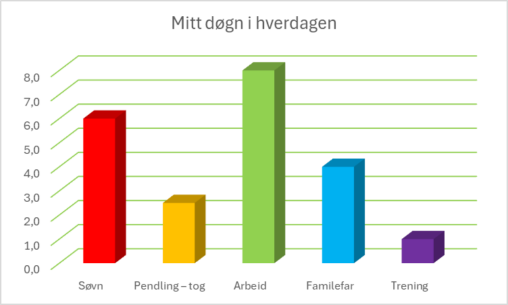
Dett er et excel-diagram som viser min typiske mandag. Dataene der laget av meg selv, og generert diagram i excel.
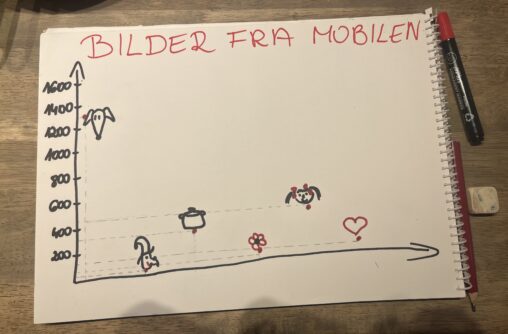
Omtrentlig antall bilder tatt med min mobil siden 5.01.2020 fram til i dag (16.02.2026), fordelt på mest fotograferte personer/objekter. – min hund 1333 – min søster 20 –…
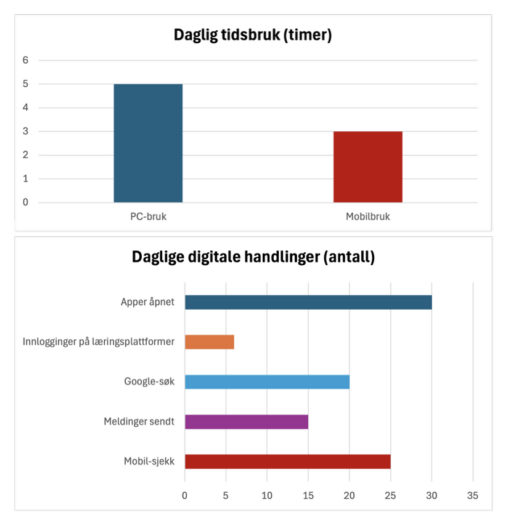
Denne visualiseringen viser en gjennomsnittlig digital studiedag basert på egenregistrerte data. Den første figuren viser daglig tidsbruk i timer på PC (5 timer) og mobil (3 timer). Den…

Datoer i januar hvor jeg har sett NUFC spille. Antall timer pr dato og fargekoding for å differensiere mellom ulike strømmetjenester.
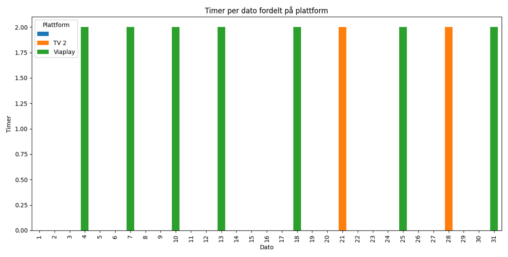
Grafisk fremstilling av hvilke dager jeg har sett NUFC spille i januar og hvor mange timer. Fargekoding for å vise hvilke strømmingstjenester som er benyttet. Excel er benyttet…
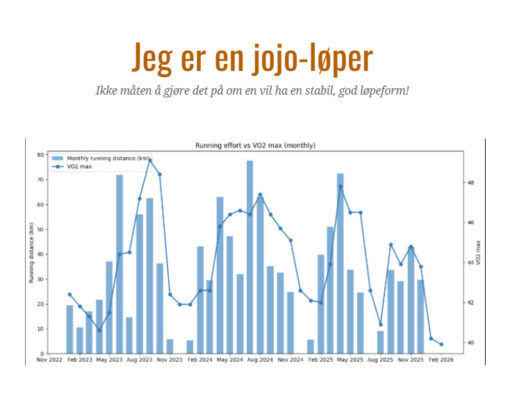
Bildet viser en grafisk fremstilling laget av ChatGTP med utgangspunkt i en csv fil med alle løpeøktene mine de siste 3 årene og en csv fil med variasjonene…
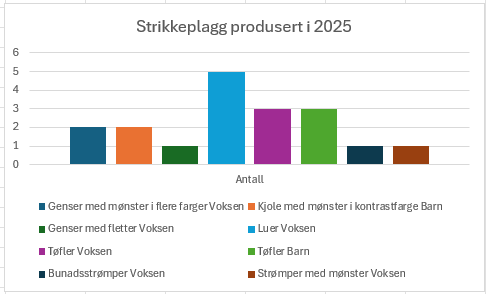
Jeg er veldig glad i å strikke og holder ofte på med det på fritiden. Det er gøy å føre oversikt over hva jeg strikker i løpet av…

Jeg bruker Excel for å lage oversikt over strikkede plagg som jeg lager i løpet av et år. Jeg blir like overrasket hvert år over antall plagg i…