
2107 Data visualizations Categorized "my life in data" (page 10 of 106)
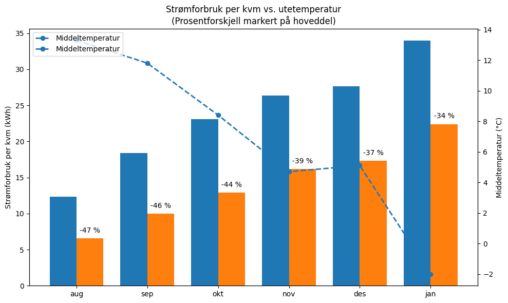
Figuren viser en sammenligning av strømforbruk per kvadratmeter mellom to boenheter i samme bolig: en leilighet på 45 kvm og en hoveddel på 105 kvm. Forbruket er justert…
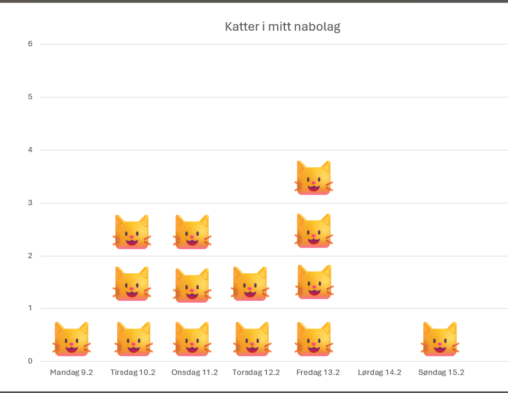
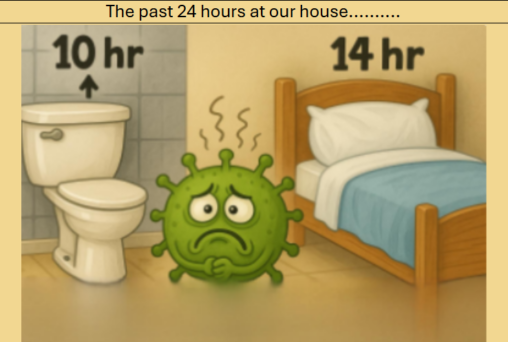
Denne visualiseringen viser antall katter observert under min daglige kveldstur i nabolaget over en periode på syv dager (9. februar – 15. februar 2026). Måleenheten i datasettet er…
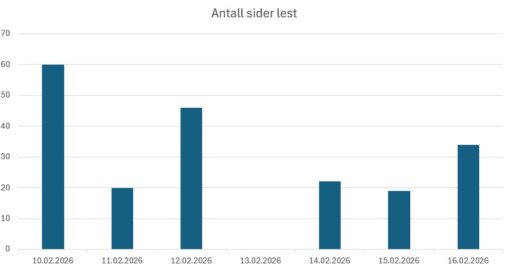
En visualisering av antall sider lest hver dag i løpet av en uke.
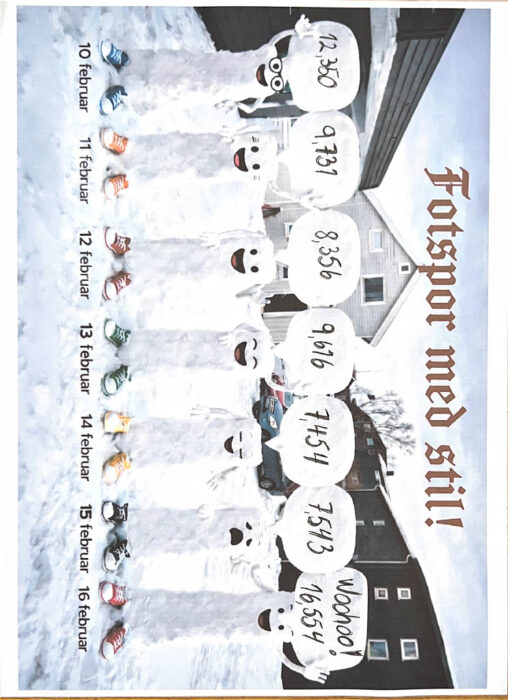
This is the steps I have been taken during my resent stay in Norway. I assume I am the owner of the photo since I took it even…
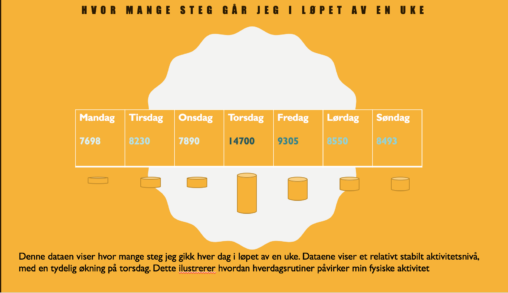
This visualization presents the number of steps I walked each day over the course of one week. The data shows a relatively stable level of physical activity throughout…
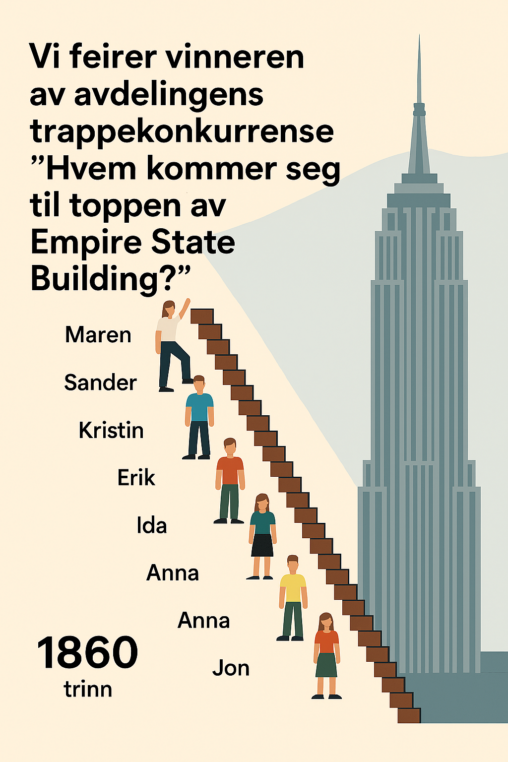
Vi hadde Trappekonkurranse på jobb. Vår avdeling holder til i 5. etasje, og vi registrerte hver gang vi gikk hele veien opp, fra første etasje. Konkurransen pågikk i…
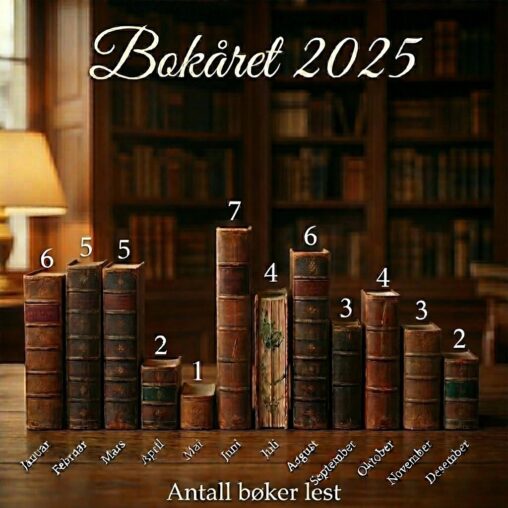
This is an overview of the number of books I read in the year 2025. I took my library loan history (the “bibliofil” app) as a starting point,…
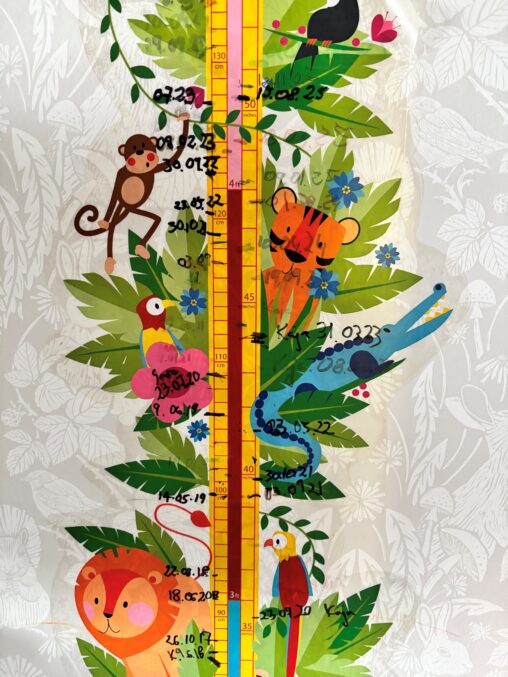
Data visualisation inneholder et bilde av høydemålingene gjennomført de siste årene på mine to døtre. Den inneholder dato for måling og høyde av S. sine målinger til venstre…
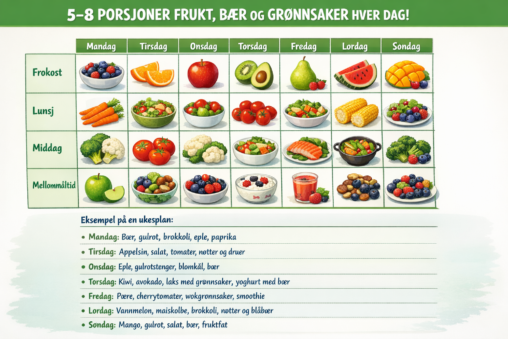
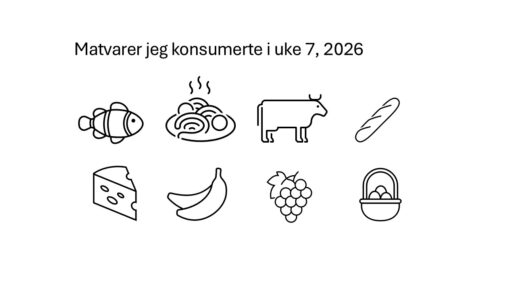
Helsedirektorates anbefaling for voksne mennesker er 5-8 porsjoner grønt/frukt per dag. Jeg prøvde å gjennomføre dette en uke og la inn hva jeg spiste av frukt og grønt…
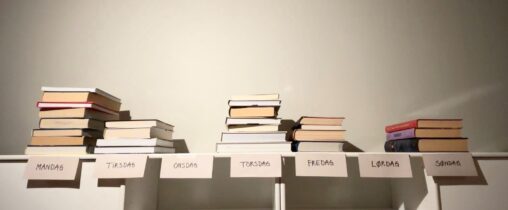
Bildet visualiserer antall studietimer brukt per dag i løpet av uke 7, 2026. En bok representerer 15 min. studietid, dvs. at stabelen med 8 bøker på mandag visualiserer…
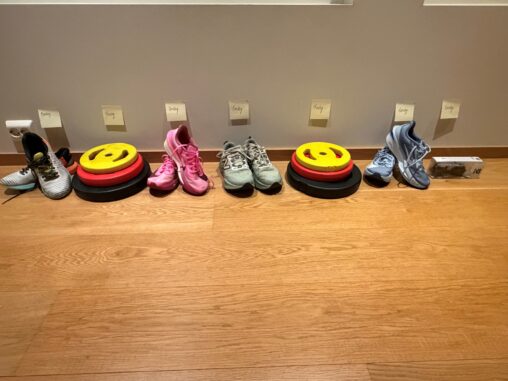
Bildet viser mine treningsaktiviteter som er loggført på Strava i uke 7 Mandag: Løpetur Tirsdag: Styrketrening Onsdag: Løpetur Torsdag: Fjellvandring Fredag: Styrketrening Lørdag: Løpetur Søndag: Svømming
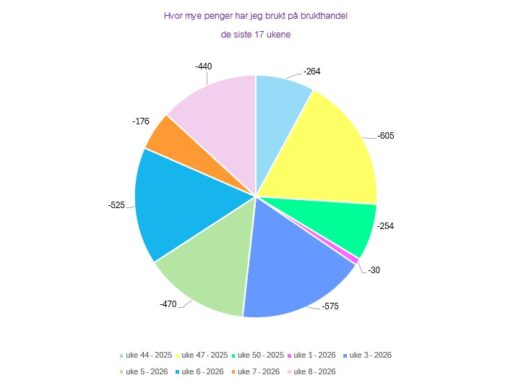
Gjenbruk- og pengebruk-statistikk samlet pr uke. Handel som har blitt gjort både i bruktbutikker og på finn.no. Kun penger ut har blitt med i statistikken.
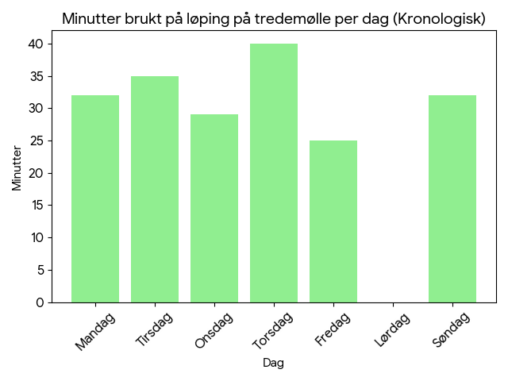
En visualisering av minutter brukt på løping på tredemølle i uke 7. Visualisering laget av Google Gemini basert på rådata fra meg.
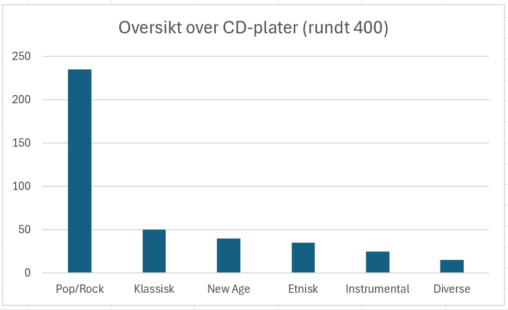
Oversikten viser antall CD-plater per sjanger. Dette er originale CD-plater som var kjøpt i løpet av flere år.
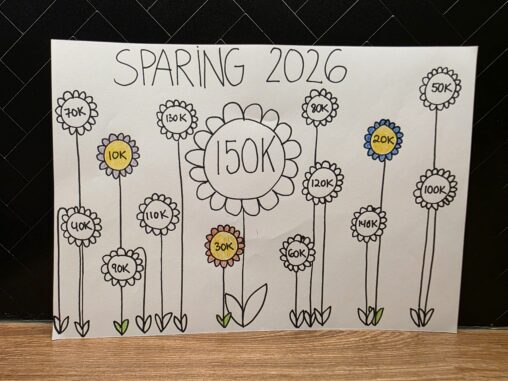
Visualiseringen viser sparemålet mitt for 2026. Hver blomst representerer 10 000 kroner, som fargelegges etter hvert som beløpet på sparekontoen øker. Dataene er hentet fra kontooversikten i egen…
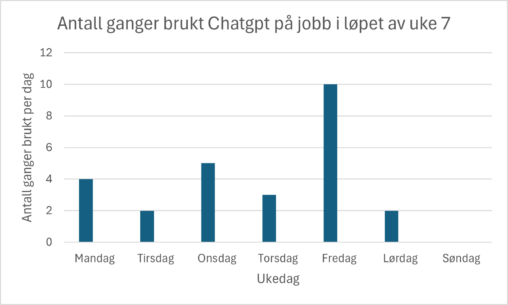
Dataen viser hvor mange ganger jeg har tatt i bruk nettstedet Chatgpt hver arbeidsdag i løpet av en arbeidsuke.
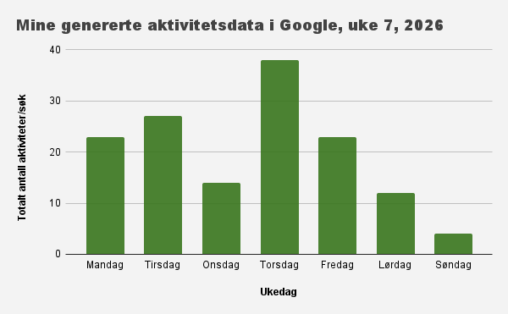
Diagrammet viser aktivitetsdata henta frå myactivity.google.com, der aktivitet er sortert på vekedagar. Aktivitetsdata inkluderar både Google-søk og “andre aktiviteter”, herunder besøk på nettsider eller bruk av appar som…
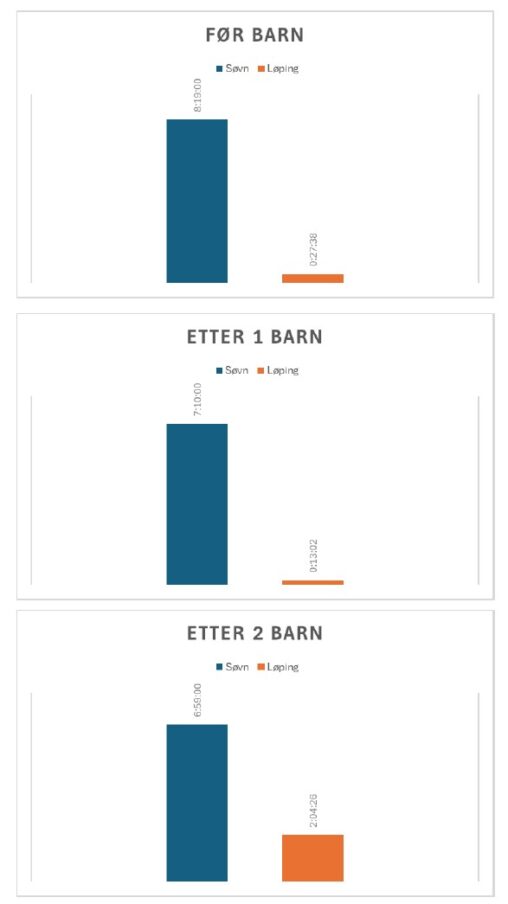
Ukentlig gjennomsnittstid for nattesøvn og løping, målt over en periode på 1 år for tre ulike faser i livet; før barn, etter 1 barn og etter 2 barn….