
171 Data visualizations Categorized "my country in data" (page 5 of 9)

The picture is generated with the “text to image” function in Adobe express. The prompt is: A DNA molecule. In the background there is a mountain. A person…


Tabellen viser antall oppdrettere av de ulike fargene mellompuddel i Norge som er medlem av Norsk Puddelklubb. En oppdretter av mellompuddel kan oppdrette flere farger, og kan derfor…
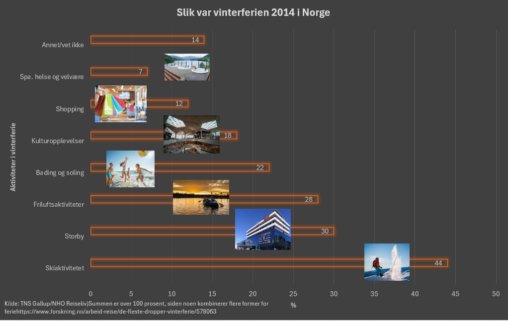
Slik var vinterferien 2014 i Norge aktivities vs percentages Source https://www.forskning.no/arbeid-reise/de-fleste-dropper-vinterferie/578063

Contrasting the cultural dimensions between France, my country of upbringing, and Norway, the country of my familial roots and present residence. Representing scores for France and Norway on…
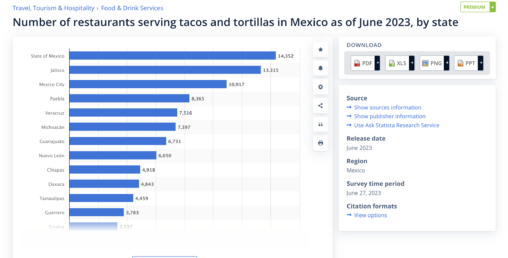
https://www.statista.com/statistics/727083/tacos-tortillas-restaurants-states-mexico/
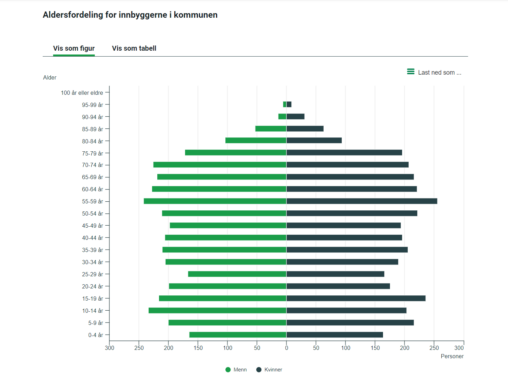
Statistikk som viser befolkningsutviklingen i Inderøy https://www.ssb.no/kommunefakta/inderoy
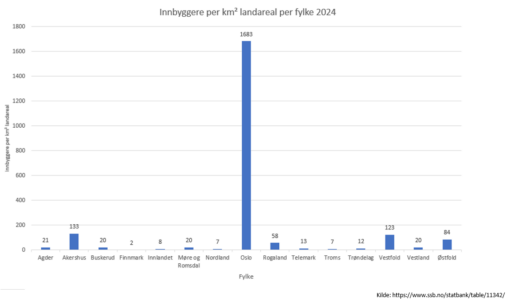
Tabellen viser hvor mange innbyggere som bor per km² landareal fordelt per fylke i Norge i 2024. Tallene er hentet fra ssb.no.

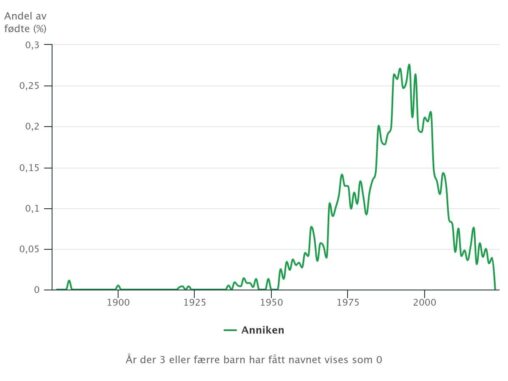
Denne grafen viser hvor mange barn som fikk navnet Anniken i perioden 1880-2022 i Norge. Grafen viser at navnet begynte å bli mer populært fra midten av 70-tallet…
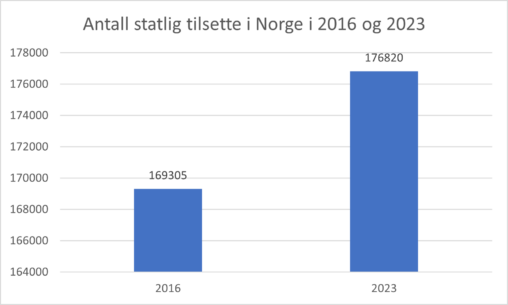
I dette bildet ser du eit diagram som viser antall ansatte i staten i 2016 og i 2023. Dataene er henta frå statistisk sentralbyrå.
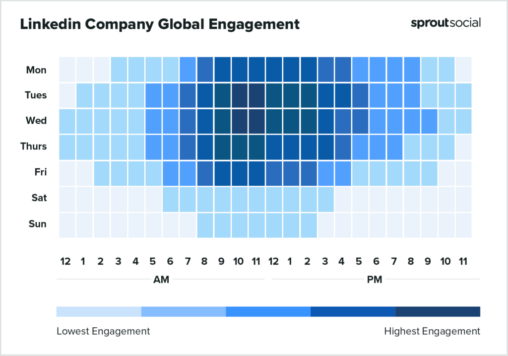
Statistikk viser de beste tidene og dårligste tidene å legge ut innhold på LinkedIn i 2023: Tirsdager og onsdager fra kl 10 til kl 12 er det beste…

Visualisering av drap og partnerdrap i Norge de siste 11 årene, vist som søylediagram. Urovekkende statistikk hvor vi ser utvikling i negativ retning. Etter alle medieoppslagene rundt partnerdrap…

Korleis bur vi Nordmenn? Er det i einebustad, rekkjehus eller blokk? Som de ser bur meir enn halvparten av oss i einebustad. SSB er eigar av data, sjå…
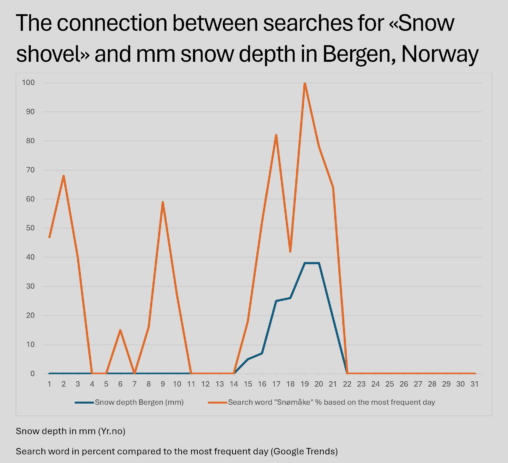
The snow depth is in millimeters for the month of January 2024 and the data is collected from yr.no a norwegian weather service. The search word “Snømåke” is…
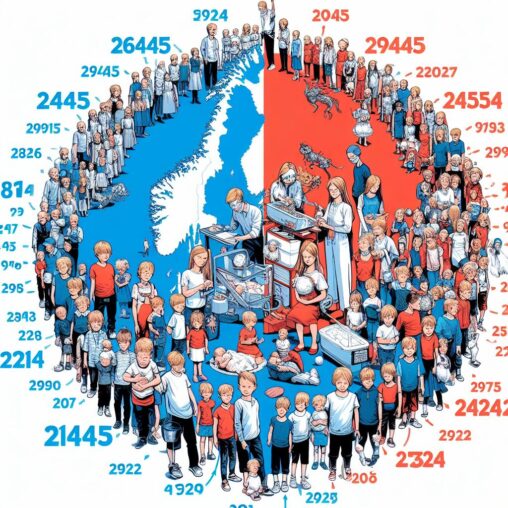
Bildet skal illustrere forskjellen mellom antall gutte- og jentefødsler i Norge i 2022. Gutter: 26 445 Jenter: 25 035
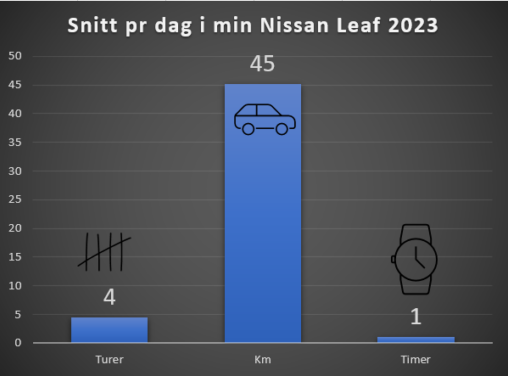
Hvor mye jeg har kjørt min Nissan Leaf i 2023. Antall turer, tidsbruk og kilometer.

The chart showes the population density (2024) for norwegian municipalities I have lived for more than 1 year during my life. The orange line showes the share in…

Visualisering av hvor ofte folk i Norge trente 2021. Data hentet fra SSB (Statistisk sentralbyrå)