
171 Data visualizations Categorized "my country in data" (page 3 of 9)
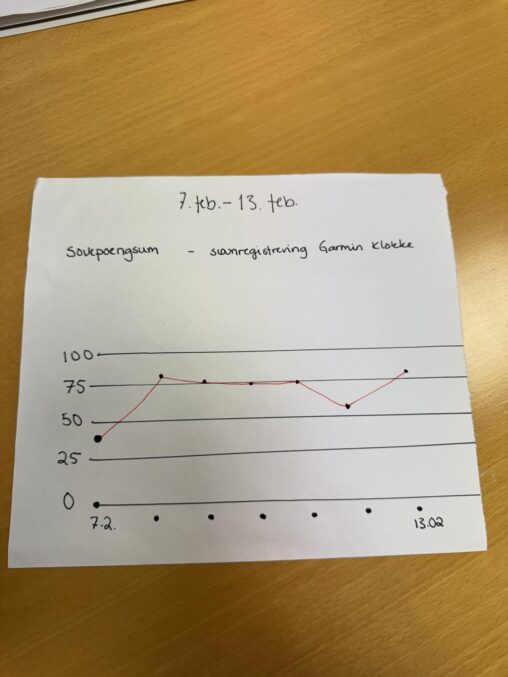
Utdrag fra data om søvnkvalitet fra min smartkloke. Målinger gjort de siste 7 dagene mellom 7.2 og fram til i dag 13.2.
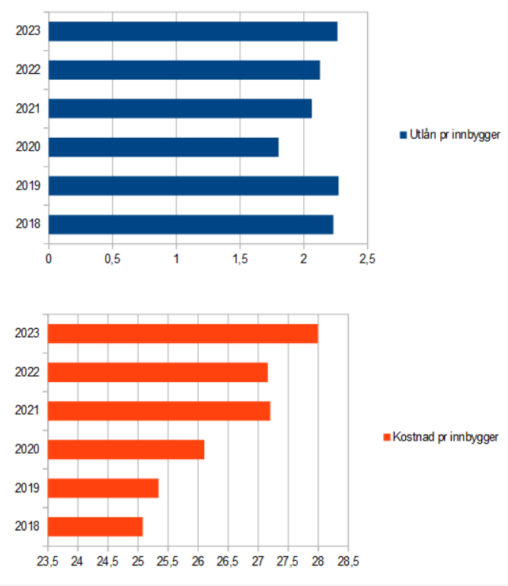
Grafene viser antall utlån av bøker i norske folkebibliotek sett opp mot mediebudsjettet fordelt pr innbygger for perioden 2018-2023. Tallene er hentet fra SSB.
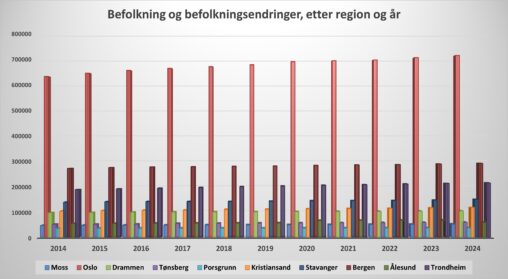
Denne visualiseringen viser informasjon om befolkningen og befolkningsendringer i Norges største tettsteder, fordelt etter innhold, år og region. Dataene gir en oversikt over hvordan befolkningen har utviklet seg…
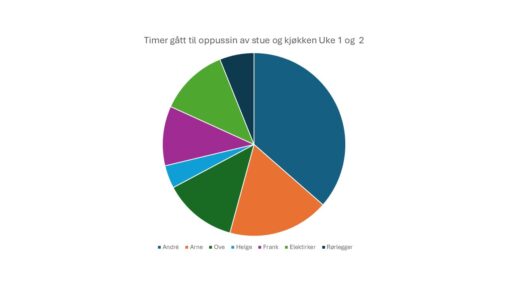
Dette er en visualisering av egen timer benyttet i oppussing samt timer andre har brukt de 2 første ukene.
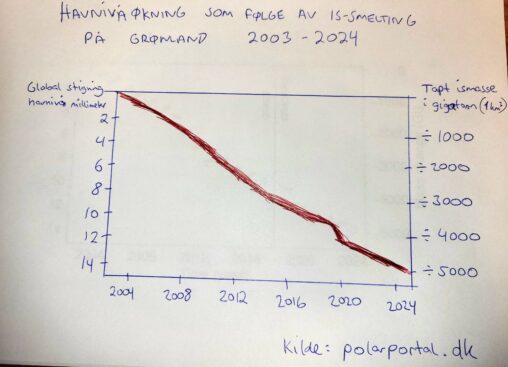
Issmelting på Grønland målt i gigatonn (høyre akse) med tidsintervall (nederst) og stigning i havnivå (venstre akse). Kilde: polarportal.dk
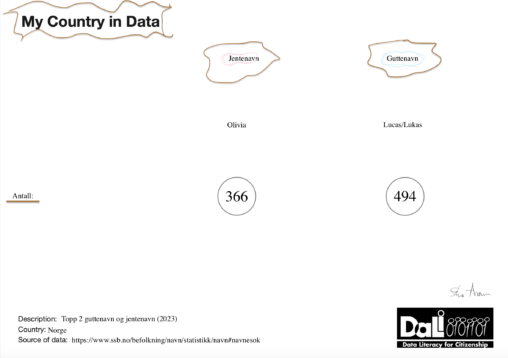
Kjært barn har mange navn! Navnetrender endrer seg fra tiår til tiår, men noen navn holder seg stabilt populære. I 2023 tronet Lucas/Lukas og Olivia øverst på listen…

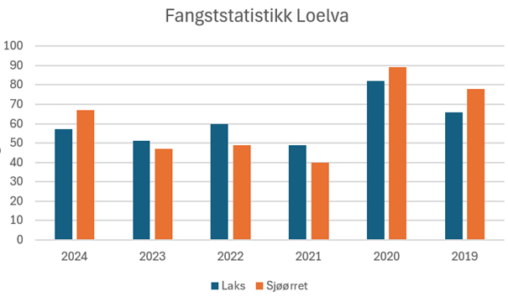
Stolpediagrammet viser antall laks og sjøørret som er fanget i Loelva de siste 4 årene.
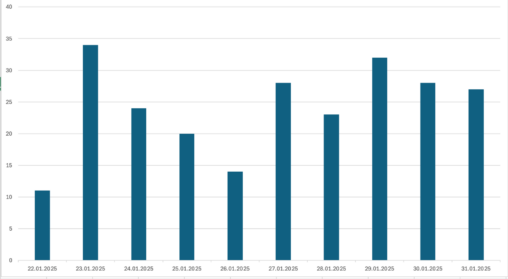
This is a dataset showing the number of different species caught in the Barents Sea by trawl from the 22nd of January to the 31st. The data in…
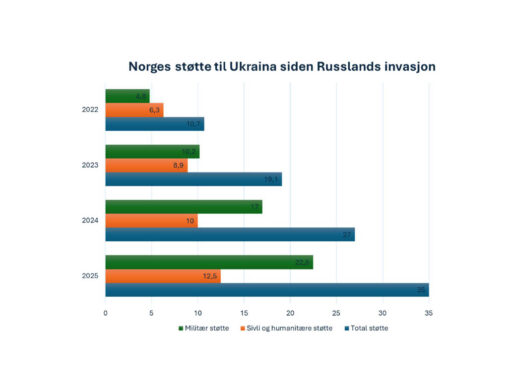
Norges støtte til Ukraina og enkelte andre nærliggende naboland fra 2022-2025 fordelt på sivil/humanitær og militær støtte. I 2022 gikk den største andelen støtte til sivile/humanitære formål, men…
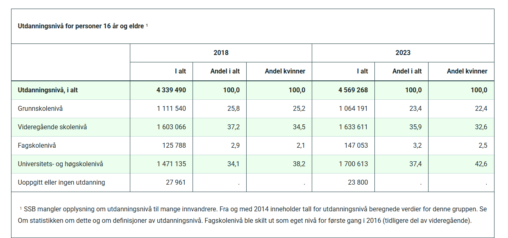
Tabellen er hentet fra nettsidene til Statistisk sentralbyrå. Den viser hvordan den norske befolkningens utdanningsnivå har endret seg fra 2018 til 2023. Stadig flere tar nå høyere utdanning,…
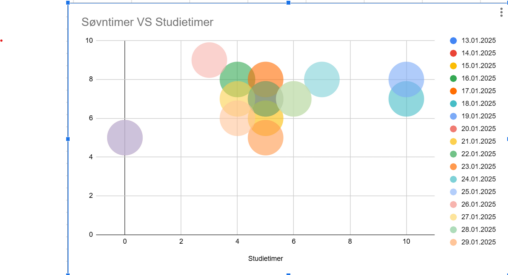
The date is visulization to see if there is corelation between the amount of hour i sleep and how many hours i studie. To see if i sleep…
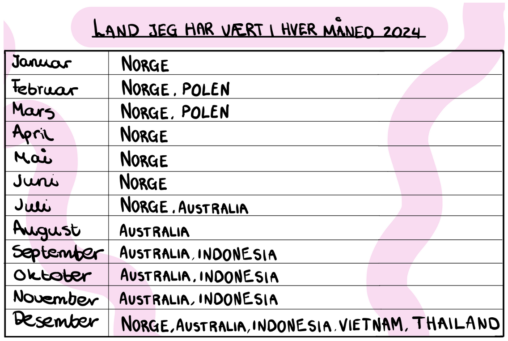
This picture represents the countries I have vistited during 2024, by month. If I have been in a country over the end of the month and over into…
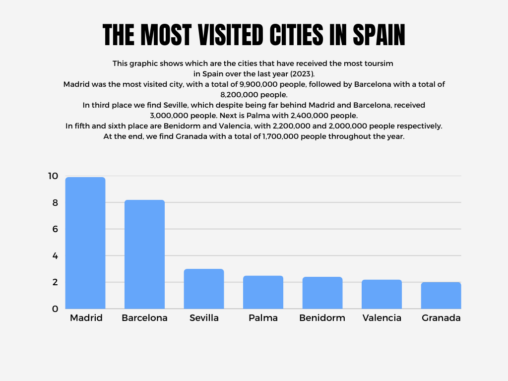
This graphic shows which are the cities that have received the most toursim in Spain over the last year (2023). Madrid was the most visited city, with a…
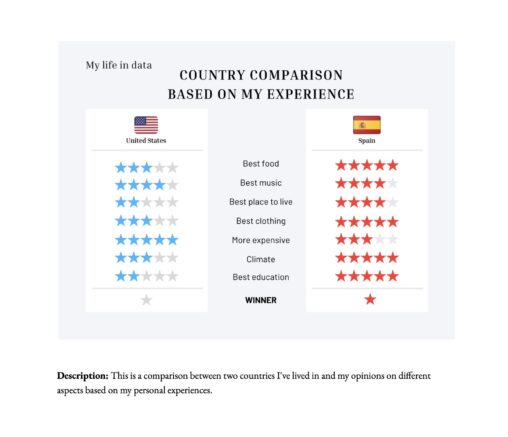
This is a comparison between two countries I’ve lived in and my opinions on different aspects based on my personal experiences.
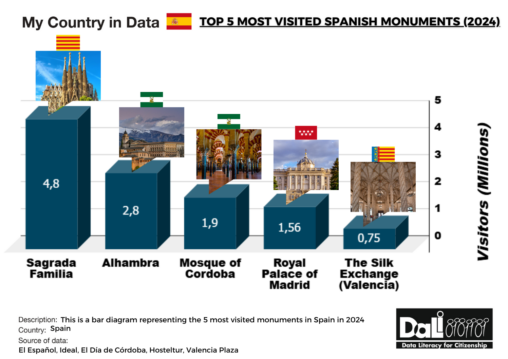
This is a bar diagram representing the 5 most visited monuments in Spain in 2024. The horizontal axis represents the monuments, and the vertical axis, the number of…
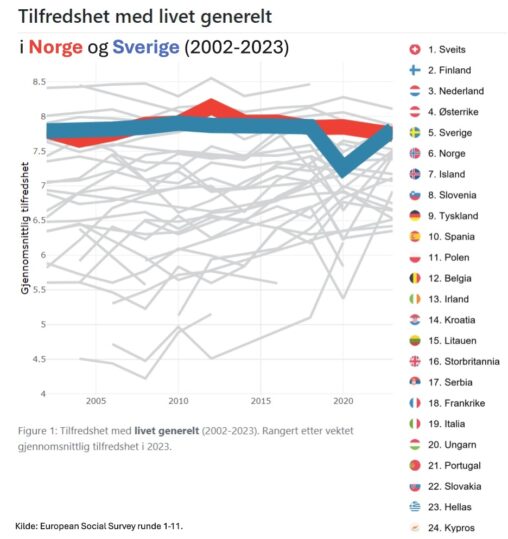
Grafen viser utviklingen av gjennomsnittlig tilfredshet med livet, der Norge og Sverige er uthevet. Til venstre er landene rangert etter vektet gjennomsnittlig tilfredshet i 2023. Dataene er hentet…

Grafen viser utviklingen av gjennomsnittlig tilfredshet med livet, der Norge og Sverige er uthevet. Til venstre er landene rangert etter vektet gjennomsnittlig tilfredshet i 2023. Dataene er hentet…