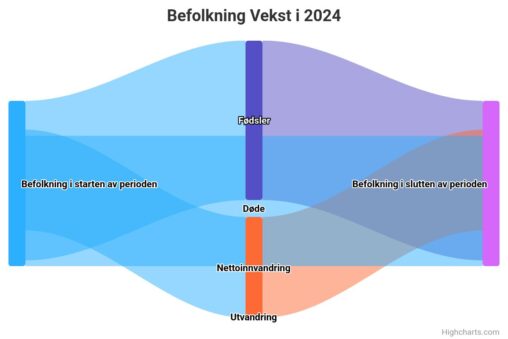
171 Data visualizations Categorized "my country in data" (page 2 of 9)

This photo was taken on a trip to Oslo when i was in hight school. I was taking photography for an extra course and it was something i…
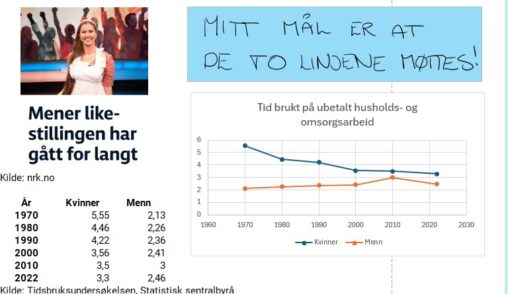
Artikkel på nrk.no om at likestillingen har gått for langt. Tidbrukundersøkelsen fra Statistisk sentralbyrå viser at kvinner fremdeles bruker mer tid en menn på arbeidsoppgaver i hjemmet. MIn…
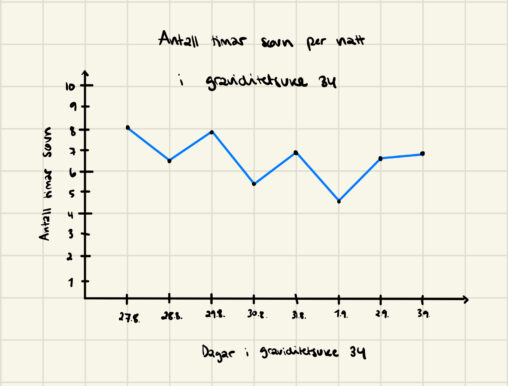
Visuell presentasjon av antall søvntimer per natt i graviditetsuke 34 for å visualisere hvor varierende søvnmengde gravide i 3. trimester får.
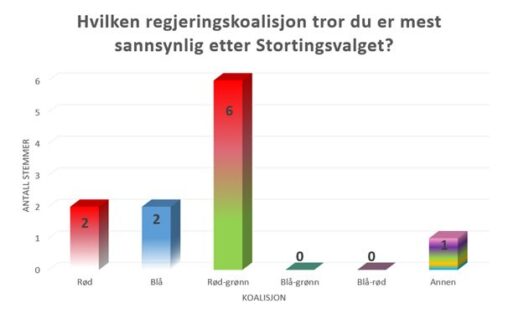
Spørreundersøkelsen ble gjennomført via Google Forms blant ansatte på Seksjonen for økonomi, NT, UiB. Per 6. september 2025 var det registrert 11 stemmer. Deltakerne kunne velge mellom følgende…
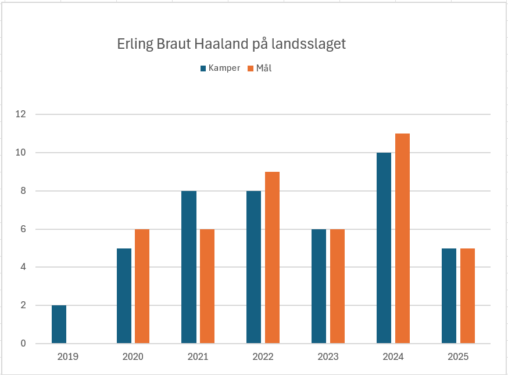
Grafen viser antall kamper og mål Haaland har scoret på landsslaget siden han debuterte på landsslaget i 2019.

This photo was taken on a trip to Oslo when i was in hight school. I was taking photography for an extra course and it was something i…
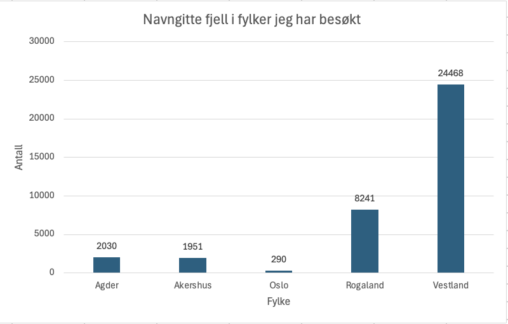
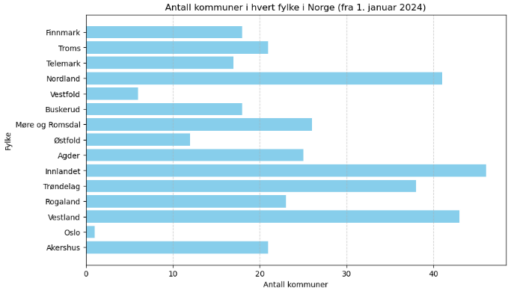
Antall navngitte fjell i kommuner jeg har besøkt i løpet av livet mitt så langt.
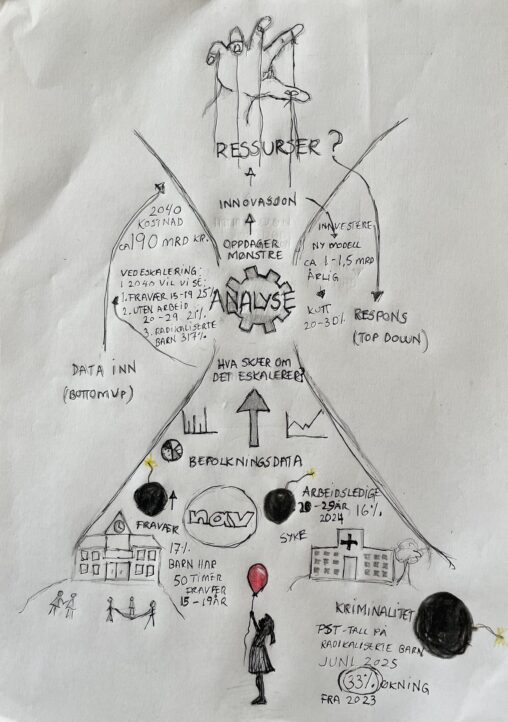
Tegningen viser en modell fremstilt som et timeglass, basert på faktiske data: 17 prosent av elever i videregående hadde over 50 timer fravær i 2023/24, 16 prosent av…
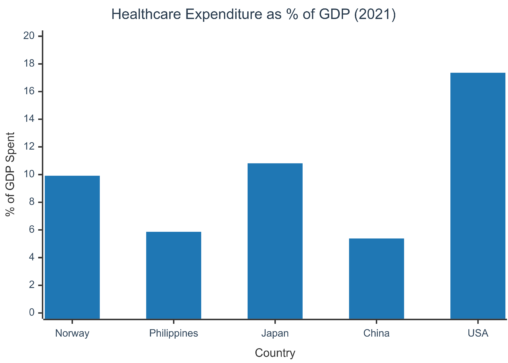
This bar chart illustrates the healthcare spending for five countries: Norway (9.92%), Philippines (5.87%), Japan (10.82%), China (5.38%), and USA (17.36%). The bars represent each country, with the…
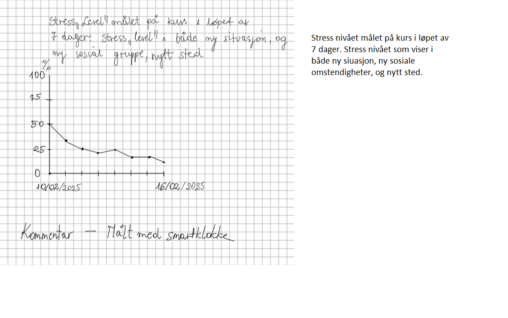
stress nivået målet på kurs i løpet av 7 dager. Stress nivået i ny situasjon, ny sosiale miljø, og nytt sted. jeg eier data
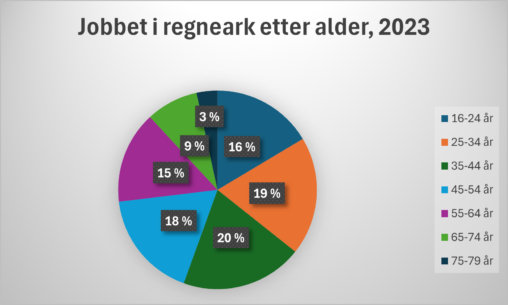
Offisiell norsk statistikk om bruk av regnearkprogram etter alder for både kvinner og menn i 2023 (Statistikken gjelder for de siste tre måneder, på intervjutidspunktet)
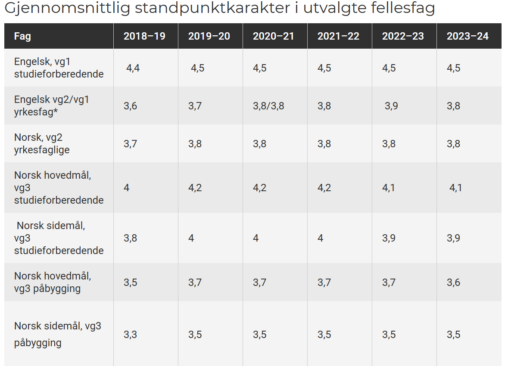
Tallmaterialet viser gjennomsnittlig karaterer i utvalgte fellesfag på videregående skule. Talla danner grunnlag for refleksjon kring eige resultat i fag, på skule og i region. Videre gir dette…
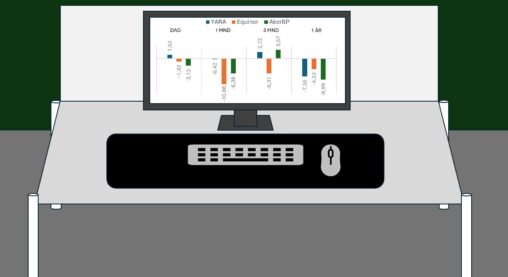
The image represents my desk at work. The graphic content on the monitor discribes the movements the last day(17.02), last month, last 3 months and last 12 months…
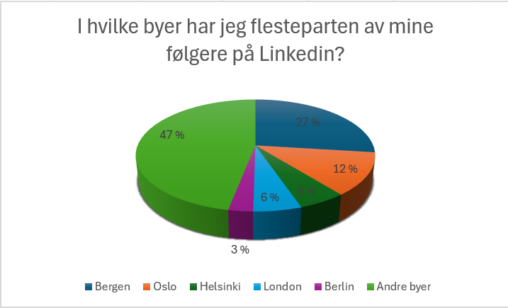
Data er hentet fra analyseseksjonen i Linkedin, for undertegnedes Linkedinprofil. Dataene representerer demografi til undertegnedes følgere. Enheter er “lokasjon” og “andel i %”. Linkedin eier dataene og har…
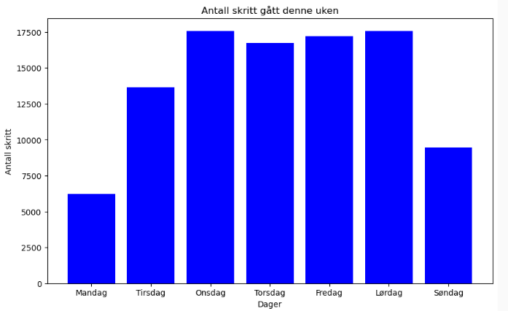
Grafene viser hvor mange skritt jeg har gått de ulike dagene i uke 7, 2025. Denne uken hadde jeg som mål å øke antall skritt fra maks 10…