
171 Data visualizations Categorized "my country in data" (page 1 of 9)
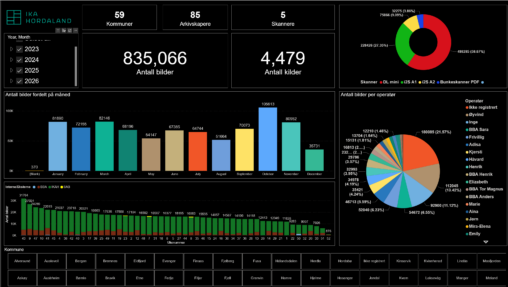
Dette er en visualisering av data over produksjon i kulturarv digitisering gjennom tid. Den gir en oversikt over antall bilder, kilder som er skannet, hvem som er operatør…
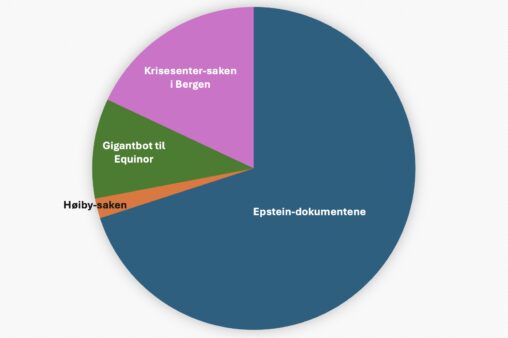
Sektordiagrammet visualiserer hvilke norske nyhetssaker gjorde sterkest inntrykk på meg vinteren 2025–2026.
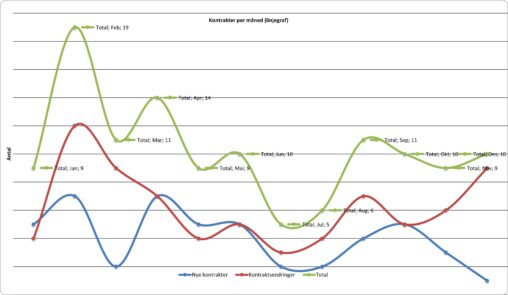
Grafen viser månedlig kontraktsaktivitet fordelt på inngåelse og signering av nye kontrakter, kontraktsendringer og total aktivitet. Totalt volum drives både av nye kontrakter og endringer, som følger et…
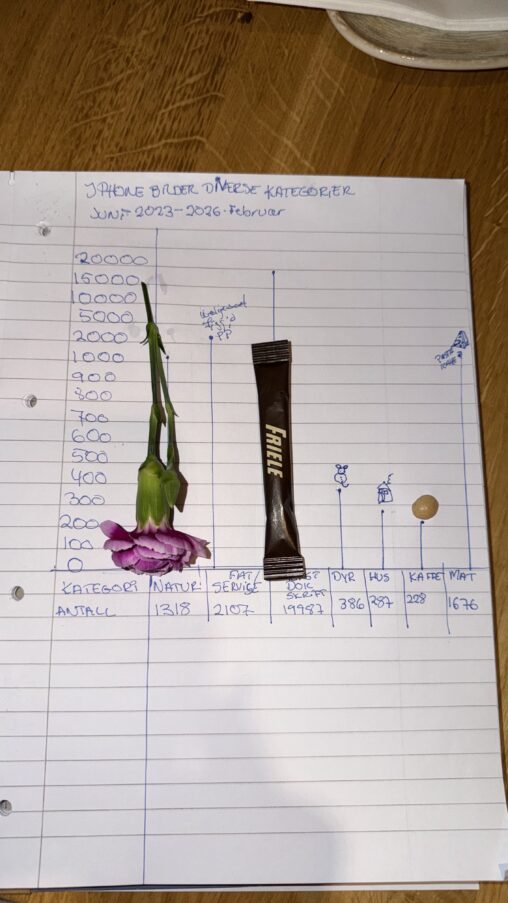
Finne ut hvilken kategori som var størst i diagrammet av ulike kategorier på mine bilder- iPhone levetid fra Juni2023-Februar2026. Kategorier: Natur,Fat/ servise, tekstdokument-skrift, hus, dyr,kaffe, mat
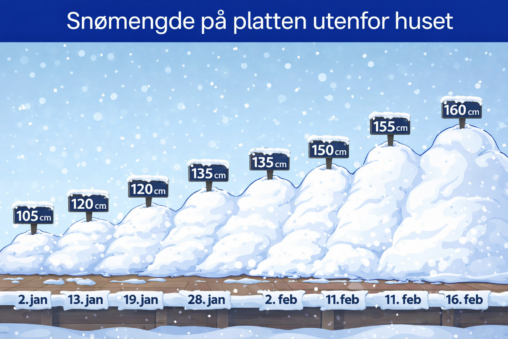
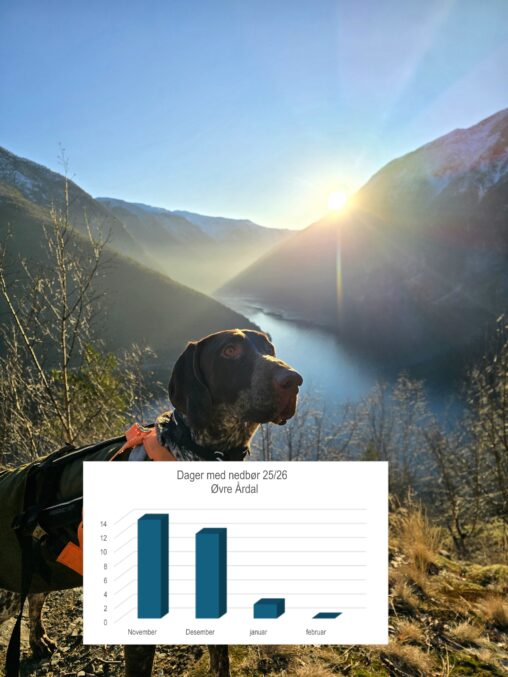
The representation is my own measurements of how much snow is on the terrace outside my house in Tromsoe, Northern Norway, in January and February. The owner of…
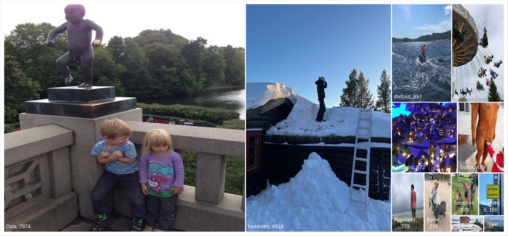
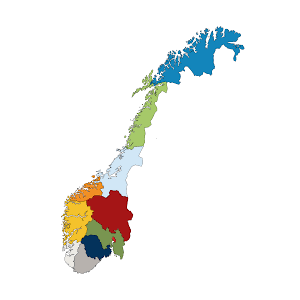
Flateproporsjonal vising av antall bilder tatt i hver fylke.

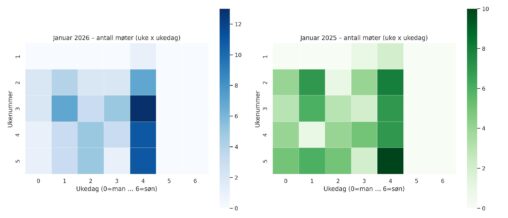
Antall møter per ukedag per uke i januar for både 2025 og 2026, basert på data fra business kalenderen. To varmekart side‑om‑side, der hver rad er ukenummer og…
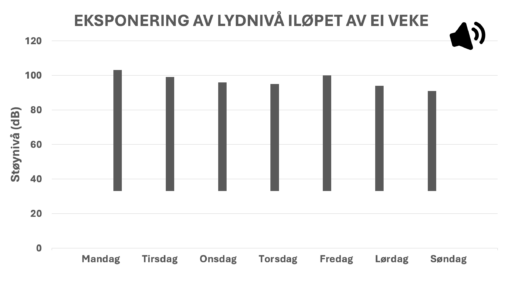
Stolpediagram som viser eit område av lydnivå ein smartklokke har registrert iløpet av ei veke, fordelt på kvar dag. Støynivået er målt i desibel (dB). Lågaste nivå på…
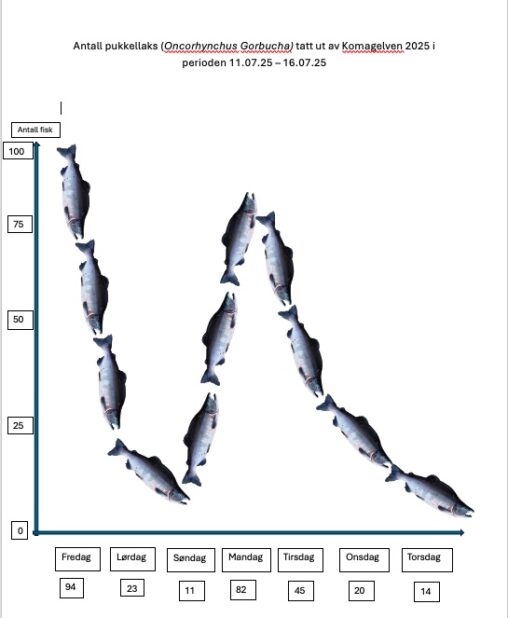
Viser en graf laget av pukkellakser som svømmer, som representerer fangsttall for en gitt periode i Komagelven. Y-aksen er antall pukkellaks, og X-aksen er dagen de ble fanget….
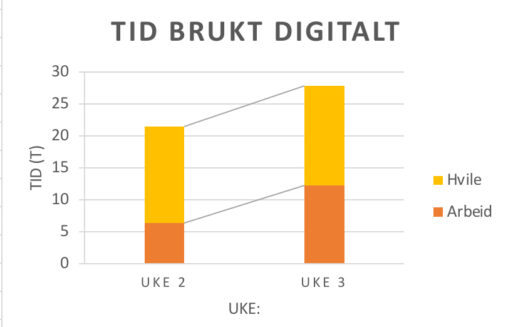
Denne visualiseringen viser hvordan min digitale skjermtid fordeler seg mellom arbeid og hvile over to påfølgende uker. Dataene er manuelt samlet fra ukentlig skjermtidsoversikt på mobil og kategorisert…
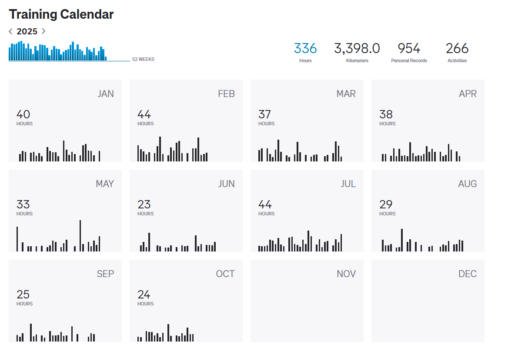
The data shows my training stats for 2025, describing total hours per month, total kilometers and personal records.
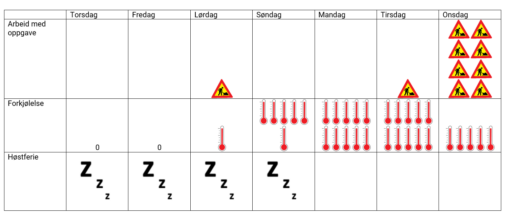
Picture describing 7 day flow containing work, a cold and a holiday. Data visualized by pasting own paintdrawings in to word.
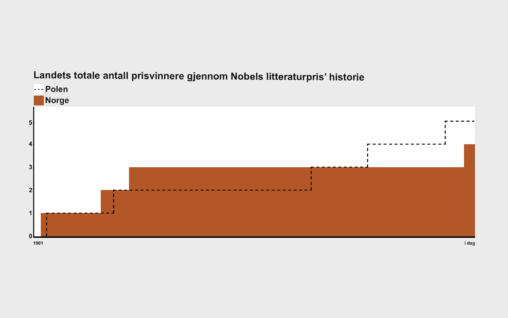
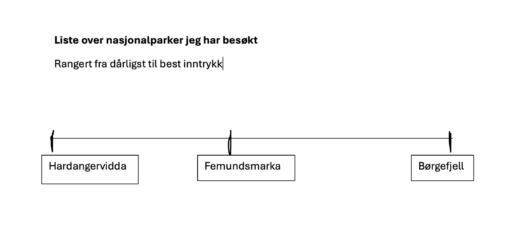
Det på et hvert tidspunkt korrekte svaret på spørsmålet “Hvor mange norske/polske forfattere har blitt tildelt Nobels litteraturpris?”.
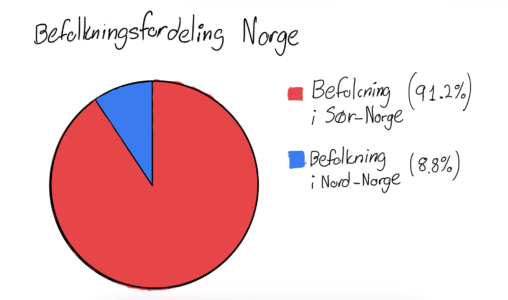
Visual representation of data describing the population spread of Northern/Southern Norway
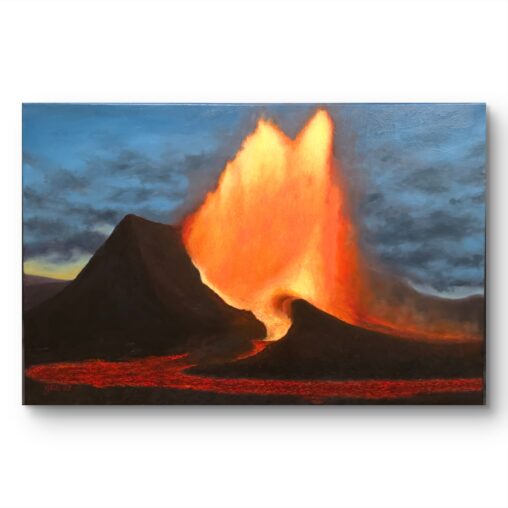
Dette er et maleri av et islandsk vulkanutbrudd, som jeg malte i for svigerinnen min i 2025. Hun er geolog og er veldig glad i vulkaner. Maleriet fikk…